SunTrust 2011 Annual Report Download - page 43
Download and view the complete annual report
Please find page 43 of the 2011 SunTrust annual report below. You can navigate through the pages in the report by either clicking on the pages listed below, or by using the keyword search tool below to find specific information within the annual report.-
 1
1 -
2
-
3
-
4
-
5
-
6
-
7
-
8
-
9
-
10
-
11
-
12
-
13
-
14
-
15
-
16
-
17
-
18
-
19
-
20
-
21
-
22
-
23
-
24
-
25
-
26
-
27
-
28
-
29
-
30
-
31
-
32
-
 33
33 -
 34
34 -
 35
35 -
 36
36 -
 37
37 -
 38
38 -
 39
39 -
 40
40 -
 41
41 -
 42
42 -
 43
43 -
 44
44 -
 45
45 -
 46
46 -
 47
47 -
 48
48 -
 49
49 -
 50
50 -
 51
51 -
 52
52 -
 53
53 -
54
-
55
-
56
-
57
-
58
-
59
-
60
-
61
-
62
-
63
-
64
-
65
-
66
-
67
-
68
-
69
-
70
-
71
-
72
-
73
-
74
-
75
-
76
-
77
-
78
-
79
-
80
-
81
-
82
-
83
-
84
-
85
-
86
-
87
-
88
-
89
-
90
-
91
-
92
-
93
-
94
-
95
-
96
-
97
-
98
-
99
-
100
-
101
-
102
-
103
-
104
-
105
-
106
-
107
-
108
-
109
-
110
-
111
-
112
-
113
-
114
-
115
-
116
-
117
-
118
-
119
-
120
-
121
-
122
-
123
-
124
-
125
-
126
-
127
-
128
-
129
-
130
-
131
-
132
-
133
-
134
-
135
-
136
-
137
-
138
-
139
-
140
-
141
-
142
-
143
-
144
-
145
-
146
-
147
-
148
-
149
-
150
-
151
-
152
-
153
-
154
-
155
-
156
-
157
-
158
-
159
-
160
-
161
-
162
-
163
-
164
-
165
-
166
-
167
-
168
-
169
-
170
-
171
-
172
-
173
-
174
-
175
-
176
-
177
-
178
-
179
-
180
-
181
-
182
-
183
-
184
-
185
-
186
-
187
-
188
-
189
-
190
-
191
-
192
-
193
-
194
-
195
-
196
-
197
-
198
-
199
-
200
-
201
-
202
-
203
-
204
-
205
-
206
-
207
-
208
-
209
-
210
-
211
-
212
-
213
-
214
-
215
-
216
-
217
-
218
-
219
-
220
-
221
-
222
-
223
-
224
-
225
-
226
-
227
 |
 |

27
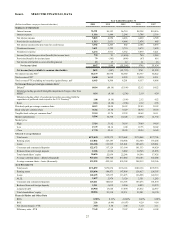
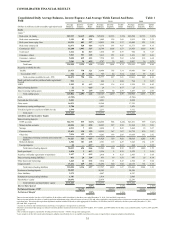
Item 6. SELECTED FINANCIAL DATA
(Dollars in millions, except per share and other data)
Summary of Operations
Interest income
Interest expense
Net interest income
Provision for credit losses1
Net interest income after provision for credit losses
Noninterest income
Noninterest expense
Income/(loss) before provision/(benefit) for income taxes
Provision/(benefit) for income taxes
Net income attributable to noncontrolling interest
Net income/(loss)
Net income/(loss) available to common shareholders
Net interest income-FTE2
Total revenue-FTE2
Total revenue-FTE excluding net securities (gains)/losses, net2
Net income/(loss) per average common share3
Diluted4
Diluted excluding goodwill/intangible impairment charges, other than
MSRs2,4
Diluted excluding effect of accelerated accretion associated with the
repurchase of preferred stock issued to the U.S. Treasury2,4
Basic
Dividends paid per average common share
Book value per common share
Tangible book value per common share2
Market capitalization
Market price:
High
Low
Close
Selected Average Balances
Total assets
Earning assets
Loans
Consumer and commercial deposits
Brokered time and foreign deposits
Total shareholders’ equity
Average common shares - diluted (thousands)
Average common shares - basic (thousands)
As of December 31
Total assets
Earning assets
Loans
ALLL
Consumer and commercial deposits
Brokered time and foreign deposits
Long-term debt
Total shareholders’ equity
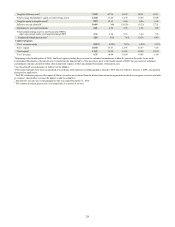
Financial Ratios and Other Data
ROA
ROE
Net interest margin - FTE
Efficiency ratio - FTE
Year Ended December 31
2011
$6,181
1,116
5,065
1,513
3,552
3,421
6,234
739
79
13
$647
$495
$5,179
8,600
8,483
$0.94
0.94
1.08
0.94
$0.12
36.86
25.18
9,504
33.14
15.79
17.70
$172,440
147,802
116,308
122,672
2,386
20,696
527,618
523,995
$176,859
154,696
122,495
2,457
125,611
2,311
10,908
20,066
0.38%
2.56
3.50
72.49
2010
$6,343
1,489
4,854
2,651
2,203
3,729
5,911
21
(185)
17
$189
($87)
$4,970
8,699
8,508
($0.18)
(0.18)
(0.18)
(0.18)
$0.04
36.34
23.76
14,768
31.92
20.16
29.51
$172,375
147,187
113,925
117,129
2,916
22,834
498,744
495,361
$172,874
148,473
115,975
2,974
120,025
3,019
13,648
23,130
0.11%
(0.49)
3.38
67.94
2009
$6,710
2,244
4,466
4,064
402
3,710
6,562
(2,450)
(898)
12
($1,564)
($1,733)
$4,589
8,299
8,201
($3.98)
(2.34)
(3.98)
(3.98)
$0.22
35.29
22.59
10,128
30.18
6.00
20.29
$175,442
150,908
121,041
113,164
6,082
22,286
437,486
435,328
$174,165
147,896
113,675
3,120
116,303
5,560
17,490
22,531
(0.89)%
(10.07)
3.04
79.07
2008
$8,328
3,708
4,620
2,474
2,146
4,473
5,879
740
(67)
11
$796
$741
$4,737
9,210
8,137
$2.12
2.19
2.12
2.12
$2.85
48.74
28.69
10,472
70.00
19.75
29.54
$175,848
152,749
125,433
101,333
14,743
18,596
350,183
348,919
$189,138
156,017
126,998
2,351
105,276
8,053
26,812
22,501
0.45%
4.20
3.10
63.83
2007
$10,036
5,316
4,720
665
4,055
3,429
5,221
2,263
616
13
$1,634
$1,593
$4,822
8,251
8,008
$4.52
4.39
4.52
4.56
$2.92
50.72
30.11
21,772
94.18
60.02
62.49
$177,796
155,204
120,081
98,020
21,856
17,928
352,688
349,346
$179,574
154,397
122,319
1,283
101,870
15,973
22,957
18,170
0.92%
9.14
3.11
63.28