SunTrust 2011 Annual Report Download - page 10
Download and view the complete annual report
Please find page 10 of the 2011 SunTrust annual report below. You can navigate through the pages in the report by either clicking on the pages listed below, or by using the keyword search tool below to find specific information within the annual report.-
 1
1 -
 2
2 -
 3
3 -
 4
4 -
 5
5 -
 6
6 -
 7
7 -
 8
8 -
 9
9 -
 10
10 -
 11
11 -
 12
12 -
 13
13 -
 14
14 -
 15
15 -
 16
16 -
 17
17 -
 18
18 -
 19
19 -
 20
20 -
 21
21 -
22
-
23
-
24
-
25
-
26
-
27
-
28
-
29
-
30
-
31
-
32
-
33
-
34
-
35
-
36
-
37
-
38
-
39
-
40
-
41
-
42
-
43
-
44
-
45
-
46
-
47
-
48
-
49
-
50
-
51
-
52
-
53
-
54
-
55
-
56
-
57
-
58
-
59
-
60
-
61
-
62
-
63
-
64
-
65
-
66
-
67
-
68
-
69
-
70
-
71
-
72
-
73
-
74
-
75
-
76
-
77
-
78
-
79
-
80
-
81
-
82
-
83
-
84
-
85
-
86
-
87
-
88
-
89
-
90
-
91
-
92
-
93
-
94
-
95
-
96
-
97
-
98
-
99
-
100
-
101
-
102
-
103
-
104
-
105
-
106
-
107
-
108
-
109
-
110
-
111
-
112
-
113
-
114
-
115
-
116
-
117
-
118
-
119
-
120
-
121
-
122
-
123
-
124
-
125
-
126
-
127
-
128
-
129
-
130
-
131
-
132
-
133
-
134
-
135
-
136
-
137
-
138
-
139
-
140
-
141
-
142
-
143
-
144
-
145
-
146
-
147
-
148
-
149
-
150
-
151
-
152
-
153
-
154
-
155
-
156
-
157
-
158
-
159
-
160
-
161
-
162
-
163
-
164
-
165
-
166
-
167
-
168
-
169
-
170
-
171
-
172
-
173
-
174
-
175
-
176
-
177
-
178
-
179
-
180
-
181
-
182
-
183
-
184
-
185
-
186
-
187
-
188
-
189
-
190
-
191
-
192
-
193
-
194
-
195
-
196
-
197
-
198
-
199
-
200
-
201
-
202
-
203
-
204
-
205
-
206
-
207
-
208
-
209
-
210
-
211
-
212
-
213
-
214
-
215
-
216
-
217
-
218
-
219
-
220
-
221
-
222
-
223
-
224
-
225
-
226
-
227
 |
 |

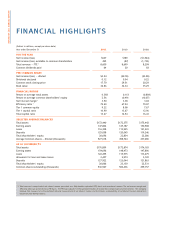
(Dollars in millions, except per share data)
Year ended December 31 2011 2010 2009
for the year
Net income/(loss) $647 $189 ($1,564)
Net income/(loss) available to common shareholders 495 (87) (1,733)
Total revenue — FTE 1 8,600 8,699 8,299
Common dividends paid 64 20 83
per common share
Net income/(loss) — diluted $0.94 ($0.18) ($3.98)
Dividends declared 0.12 0.04 0.22
Common stock closing price 17.70 29.51 20.29
Book value 36.86 36.34 35.29
financial ratios
Return on average total assets 0.38% 0.11% (0.89)%
Return on average common shareholders’ equity 2.56 (0.49) (10.07)
Net interest margin 1 3.50 3.38 3.04
Efciency ratio 1 72.49 67.94 79.07
Tier 1 common equity 9.22 8.08 7.67
Tier 1 capital ratio 10.90 13.67 12.96
Total capital ratio 13.67 16.54 16.43
selected average balances
Total assets $172,440 $172,375 $175,442
Earning assets 147,802 147,187 150,908
Loans 116,308 113,925 121,041
Deposits 125,058 120,045 119,246
Total shareholders’ equity 20,696 22,834 22,286
Average Common shares — diluted (thousands) 527,618 498,744 437,486
as of december 31
Total assets $176,859 $172,874 $174,165
Earning assets 154,696 148,473 147,896
Loans 122,495 115,975 113,675
Allowance for loan and lease losses 2,457 2,974 3,120
Deposits 127,922 123,044 121,863
Total shareholders’ equity 20,066 23,130 22,531
Common shares outstanding (thousands) 536,967 500,436 499,157
1 Total revenue is comprised of net interest income presented on a fully-taxable equivalent (FTE) basis and noninterest income. The net interest margin and
efficiency ratios are presented on a FTE basis. The FTE basis adjusts for the tax-favored status of income from certain loans and investments. The Company
believes this measure to be the preferred industry measurement of net interest income and it enhances comparability of net interest income arising from
taxable and tax-exempt sources.
financial highlights
SUNTRUST 2011 ANNUAL REPORT