SunTrust 2011 Annual Report Download - page 94
Download and view the complete annual report
Please find page 94 of the 2011 SunTrust annual report below. You can navigate through the pages in the report by either clicking on the pages listed below, or by using the keyword search tool below to find specific information within the annual report.-
 1
1 -
2
-
3
-
4
-
5
-
6
-
7
-
8
-
9
-
10
-
11
-
12
-
13
-
14
-
15
-
16
-
17
-
18
-
19
-
20
-
21
-
22
-
23
-
24
-
25
-
26
-
27
-
28
-
29
-
30
-
31
-
32
-
33
-
34
-
35
-
36
-
37
-
38
-
39
-
40
-
41
-
42
-
43
-
44
-
45
-
46
-
47
-
48
-
49
-
50
-
51
-
52
-
53
-
54
-
55
-
56
-
57
-
58
-
59
-
60
-
61
-
62
-
63
-
64
-
65
-
66
-
67
-
68
-
69
-
70
-
71
-
72
-
73
-
74
-
75
-
76
-
77
-
78
-
79
-
80
-
81
-
82
-
83
-
 84
84 -
 85
85 -
 86
86 -
 87
87 -
 88
88 -
 89
89 -
 90
90 -
 91
91 -
 92
92 -
 93
93 -
 94
94 -
 95
95 -
 96
96 -
 97
97 -
 98
98 -
 99
99 -
 100
100 -
 101
101 -
 102
102 -
 103
103 -
 104
104 -
105
-
106
-
107
-
108
-
109
-
110
-
111
-
112
-
113
-
114
-
115
-
116
-
117
-
118
-
119
-
120
-
121
-
122
-
123
-
124
-
125
-
126
-
127
-
128
-
129
-
130
-
131
-
132
-
133
-
134
-
135
-
136
-
137
-
138
-
139
-
140
-
141
-
142
-
143
-
144
-
145
-
146
-
147
-
148
-
149
-
150
-
151
-
152
-
153
-
154
-
155
-
156
-
157
-
158
-
159
-
160
-
161
-
162
-
163
-
164
-
165
-
166
-
167
-
168
-
169
-
170
-
171
-
172
-
173
-
174
-
175
-
176
-
177
-
178
-
179
-
180
-
181
-
182
-
183
-
184
-
185
-
186
-
187
-
188
-
189
-
190
-
191
-
192
-
193
-
194
-
195
-
196
-
197
-
198
-
199
-
200
-
201
-
202
-
203
-
204
-
205
-
206
-
207
-
208
-
209
-
210
-
211
-
212
-
213
-
214
-
215
-
216
-
217
-
218
-
219
-
220
-
221
-
222
-
223
-
224
-
225
-
226
-
227
 |
 |

78
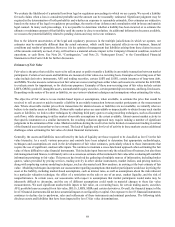
The slight difference from December 31, 2010 to December 31, 2011 seen above in both the economic and financial reporting
perspectives related to the +100 basis point shock scenario is primarily due to a slight increase in asset sensitivity from projected
balance sheet growth of floating rate assets funded with low cost deposits.
We also perform valuation analysis, which is used for discerning levels of risk present in the balance sheet and derivative positions
that might not be taken into account in the net interest income simulation analysis above. Whereas net interest income simulation
highlights exposures over a relatively short time horizon, valuation analysis incorporates all cash flows over the estimated remaining
life of all balance sheet and derivative positions. The valuation of the balance sheet, at a point in time, is defined as the discounted
present value of asset cash flows and derivative cash flows minus the discounted present value of liability cash flows, the net of
which is referred to as MVE. The sensitivity of MVE to changes in the level of interest rates is a measure of the longer-term
repricing risk and options risk embedded in the balance sheet. Similar to the net interest income simulation, MVE uses instantaneous
changes in rates. MVE values only the current balance sheet and does not incorporate the growth assumptions that are used in the
net interest income simulation model. As with the net interest income simulation model, assumptions about the timing and variability
of balance sheet cash flows are critical in the MVE analysis. Particularly important are the assumptions driving prepayments and
the expected changes in balances and pricing of the indeterminate deposit portfolios.
As of December 31, 2011, the MVE profile indicates changes with respect to an instantaneous 100 basis point change in rates.
MVE sensitivity is reported in both upward and downward rate shocks. However, results at December 31, 2011 in the downward
rate shock is significantly less meaningful than the upward rate shock. In a -100 shock scenario, current interest rate levels that
are already at or near 0% are adversely impacting discounted cash flow analysis causing the short end of the discount curve to be
zero bound and therefore, the shock behaves more like a curve flattener than a parallel shock.
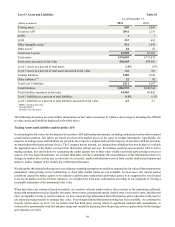
Market Value of Equity Sensitivity
(Basis points)
Rate Change
+100
-1001
Estimated % Change in MVE
December 31, 2011
(2.4)%
(0.9)%
Table 32
December 31, 2010
(3.4)%
1.1%
1 Given the inherent limitations of certain of these measurement tools and techniques, results become less meaningful as interest rates approach zero.
While an instantaneous and severe shift in interest rates is used in this analysis to provide an estimate of exposure under an
extremely adverse scenario, we believe that a gradual shift in interest rates would have a much more modest impact. Since MVE
measures the discounted present value of cash flows over the estimated lives of instruments, the change in MVE does not directly
correlate to the degree that earnings would be impacted over a shorter time horizon (i.e., the current fiscal year). Further, MVE
does not take into account factors such as future balance sheet growth, changes in product mix, changes in yield curve relationships,
and changing product spreads that could mitigate the adverse impact of changes in interest rates. The net interest income simulation
and valuation analyses do not include actions that management may undertake to manage this risk in response to anticipated
changes in interest rates.
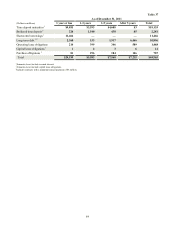
Market Risk from Trading Activities
Under established policies and procedures, we manage market risk associated with trading, capital markets, and foreign exchange
activities using a VAR approach that determines total exposure arising from interest rate risk, equity risk, foreign exchange risk,
spread risk, and volatility risk. For trading portfolios, VAR measures the estimated maximum loss from a trading position, given
a specified confidence level and time horizon. VAR exposures and actual results are monitored daily for each trading portfolio.
Our VAR calculation measures the potential losses using a 99% confidence level with a one day holding period. This means that,
on average, losses are expected to exceed VAR two or three times per year. We had no backtest exceptions to our overall VAR for
the years ended December 31, 2011 and 2010. The following table presents high, low, and average VAR for the years ended
December 31, 2011 and 2010.