SunTrust 2011 Annual Report Download - page 215
Download and view the complete annual report
Please find page 215 of the 2011 SunTrust annual report below. You can navigate through the pages in the report by either clicking on the pages listed below, or by using the keyword search tool below to find specific information within the annual report.-
 1
1 -
2
-
3
-
4
-
5
-
6
-
7
-
8
-
9
-
10
-
11
-
12
-
13
-
14
-
15
-
16
-
17
-
18
-
19
-
20
-
21
-
22
-
23
-
24
-
25
-
26
-
27
-
28
-
29
-
30
-
31
-
32
-
33
-
34
-
35
-
36
-
37
-
38
-
39
-
40
-
41
-
42
-
43
-
44
-
45
-
46
-
47
-
48
-
49
-
50
-
51
-
52
-
53
-
54
-
55
-
56
-
57
-
58
-
59
-
60
-
61
-
62
-
63
-
64
-
65
-
66
-
67
-
68
-
69
-
70
-
71
-
72
-
73
-
74
-
75
-
76
-
77
-
78
-
79
-
80
-
81
-
82
-
83
-
84
-
85
-
86
-
87
-
88
-
89
-
90
-
91
-
92
-
93
-
94
-
95
-
96
-
97
-
98
-
99
-
100
-
101
-
102
-
103
-
104
-
105
-
106
-
107
-
108
-
109
-
110
-
111
-
112
-
113
-
114
-
115
-
116
-
117
-
118
-
119
-
120
-
121
-
122
-
123
-
124
-
125
-
126
-
127
-
128
-
129
-
130
-
131
-
132
-
133
-
134
-
135
-
136
-
137
-
138
-
139
-
140
-
141
-
142
-
143
-
144
-
145
-
146
-
147
-
148
-
149
-
150
-
151
-
152
-
153
-
154
-
155
-
156
-
157
-
158
-
159
-
160
-
161
-
162
-
163
-
164
-
165
-
166
-
167
-
168
-
169
-
170
-
171
-
172
-
173
-
174
-
175
-
176
-
177
-
178
-
179
-
180
-
181
-
182
-
183
-
184
-
185
-
186
-
187
-
188
-
189
-
190
-
191
-
192
-
193
-
194
-
195
-
196
-
197
-
198
-
199
-
200
-
201
-
202
-
203
-
204
-
 205
205 -
 206
206 -
 207
207 -
 208
208 -
 209
209 -
 210
210 -
 211
211 -
 212
212 -
 213
213 -
 214
214 -
 215
215 -
 216
216 -
 217
217 -
 218
218 -
 219
219 -
 220
220 -
 221
221 -
 222
222 -
 223
223 -
 224
224 -
 225
225 -
226
-
227
 |
 |

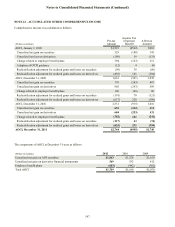
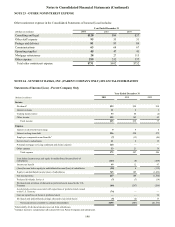
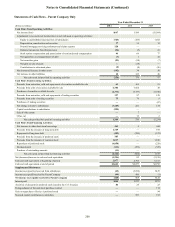
Notes to Consolidated Financial Statements (Continued)
199
Balance Sheets - Parent Company Only
(Dollars in millions)
Assets
Cash held at SunTrust Bank
Interest-bearing deposits held at other banks
Interest-bearing deposits held at SunTrust Bank
Cash and cash equivalents
Trading assets
Securities available for sale
Loans to subsidiaries
Investment in capital stock of subsidiaries stated on the
basis of the Company’s equity in subsidiaries’ capital accounts:
Banking subsidiaries
Nonbanking subsidiaries
Goodwill
Other assets
Total assets
Liabilities and Shareholders’ Equity
Short-term borrowings:
Subsidiaries
Non-affiliated companies
Long-term debt:
Subsidiaries
Non-affiliated companies
Other liabilities
Total liabilities
Preferred stock
Common stock
Additional paid in capital
Retained earnings
Treasury stock, at cost, and other
AOCI, net of tax
Total shareholders’ equity
Total liabilities and shareholders’ equity
December 31
2011
$220
19
1,402
1,641
93
324
3,666
21,783
1,278
99
397
$29,281
$392
1,710
160
6,294
766
9,322
275
550
9,306
8,978
(899)
1,749
19,959
$29,281
2010
$1
19
2,857
2,877
207
4,717
481
20,631
1,249
99
324
$30,585
$284
1,355
160
4,978
807
7,584
4,942
515
8,403
8,542
(1,017)
1,616
23,001
$30,585