SunTrust 2011 Annual Report Download - page 156
Download and view the complete annual report
Please find page 156 of the 2011 SunTrust annual report below. You can navigate through the pages in the report by either clicking on the pages listed below, or by using the keyword search tool below to find specific information within the annual report.-
 1
1 -
2
-
3
-
4
-
5
-
6
-
7
-
8
-
9
-
10
-
11
-
12
-
13
-
14
-
15
-
16
-
17
-
18
-
19
-
20
-
21
-
22
-
23
-
24
-
25
-
26
-
27
-
28
-
29
-
30
-
31
-
32
-
33
-
34
-
35
-
36
-
37
-
38
-
39
-
40
-
41
-
42
-
43
-
44
-
45
-
46
-
47
-
48
-
49
-
50
-
51
-
52
-
53
-
54
-
55
-
56
-
57
-
58
-
59
-
60
-
61
-
62
-
63
-
64
-
65
-
66
-
67
-
68
-
69
-
70
-
71
-
72
-
73
-
74
-
75
-
76
-
77
-
78
-
79
-
80
-
81
-
82
-
83
-
84
-
85
-
86
-
87
-
88
-
89
-
90
-
91
-
92
-
93
-
94
-
95
-
96
-
97
-
98
-
99
-
100
-
101
-
102
-
103
-
104
-
105
-
106
-
107
-
108
-
109
-
110
-
111
-
112
-
113
-
114
-
115
-
116
-
117
-
118
-
119
-
120
-
121
-
122
-
123
-
124
-
125
-
126
-
127
-
128
-
129
-
130
-
131
-
132
-
133
-
134
-
135
-
136
-
137
-
138
-
139
-
140
-
141
-
142
-
143
-
144
-
145
-
 146
146 -
 147
147 -
 148
148 -
 149
149 -
 150
150 -
 151
151 -
 152
152 -
 153
153 -
 154
154 -
 155
155 -
 156
156 -
 157
157 -
 158
158 -
 159
159 -
 160
160 -
 161
161 -
 162
162 -
 163
163 -
 164
164 -
 165
165 -
 166
166 -
167
-
168
-
169
-
170
-
171
-
172
-
173
-
174
-
175
-
176
-
177
-
178
-
179
-
180
-
181
-
182
-
183
-
184
-
185
-
186
-
187
-
188
-
189
-
190
-
191
-
192
-
193
-
194
-
195
-
196
-
197
-
198
-
199
-
200
-
201
-
202
-
203
-
204
-
205
-
206
-
207
-
208
-
209
-
210
-
211
-
212
-
213
-
214
-
215
-
216
-
217
-
218
-
219
-
220
-
221
-
222
-
223
-
224
-
225
-
226
-
227
 |
 |

Notes to Consolidated Financial Statements (Continued)
140
The Company does not consolidate certain wholly-owned trusts which had been formed for the sole purpose of issuing trust
preferred securities. The proceeds from the trust preferred securities issuances were invested in junior subordinated debentures of
the Parent Company. The obligations of these debentures constitute a full and unconditional guarantee by the Parent Company of
the trust preferred securities.
During 2011, the Company issued $1.0 billion of 3.60% senior notes that will mature in 2016, and $750 million of 3.50% senior
notes that will mature in 2017. During the year, a $2.1 billion senior note, $1.1 billion of foreign denominated debt, and $852
million of subordinated debt matured. Additionally, the Company repurchased and retired $395 million and $101 million of junior
subordinated notes that were due in 2036 and 2042, respectively, and recognized a net gain of $3 million.
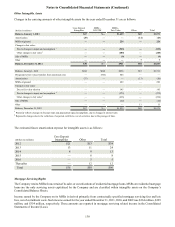
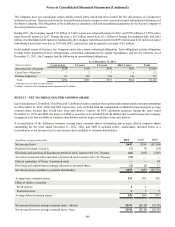
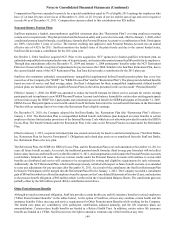
In the normal course of business, the Company enters into certain contractual obligations. Such obligations include obligations
to make future payments on lease arrangements, contractual commitments for capital expenditures, and service contracts. As of
December 31, 2011, the Company had the following in unconditional obligations:
(Dollars in millions)
Operating lease obligations
Capital lease obligations 1
Purchase obligations 2
Total
As of December 31, 2011
1 year or less
$214
1
81
$296
1-3 years
$399
2
296
$697
3-5 years
$346
3
184
$533
After 5 years
$509
6
146
$661
Total
$1,468
12
707
$2,187
1 Amounts do not include accrued interest.
2 Includes contracts with a minimum annual payment of $5 million.
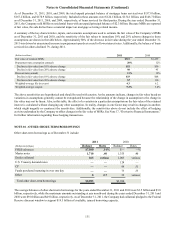
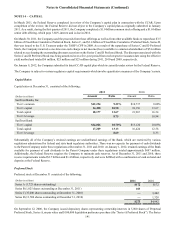
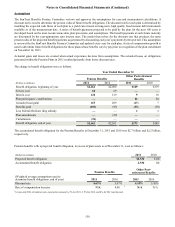
NOTE 13 – NET INCOME/(LOSS) PER COMMON SHARE
Equivalent shares of 26 million, 31 million, and 32 million related to common stock options and common stock warrants outstanding
as of December 31, 2011, 2010, and 2009 respectively, were excluded from the computations of diluted income/(loss) per average
common share because they would have been anti-dilutive. Further, for EPS calculation purposes, during the years ended
December 31, 2010 and 2009, the impact of dilutive securities was excluded from the diluted share count because the Company
recognized a net loss available to common shareholders and the impact would have been anti-dilutive.
A reconciliation of the difference between average basic common shares outstanding and average diluted common shares
outstanding for the years ended December 31, 2011, 2010, and 2009 is included below. Additionally, included below is a
reconciliation of net income/(loss) to net income/(loss) available to common shareholders.
(In millions, except per share data)
Net income/(loss)
Preferred dividends, Series A
Dividends and accretion of discount on preferred stock issued to the U.S. Treasury
Accretion associated with repurchase of preferred stock issued to the U.S. Treasury
Gain on repurchase of Series A preferred stock
Dividends and undistributed earnings allocated to unvested shares
Net income/(loss) available to common shareholders
Average basic common shares
Effect of dilutive securities:
Stock options
Restricted stock
Average diluted common shares
Net income/(loss) per average common share - diluted
Net income/(loss) per average common share - basic
2011
$647
(7)
(66)
(74)
—
(5)
$495
524
2
2
528
$0.94
$0.94
2010
$189
(7)
(267)
—
—
(2)
($87)
495
1
3
499
($0.18)
($0.18)
2009
($1,564)
(14)
(266)
—
94
17
($1,733)
435
—
2
437
($3.98)
($3.98)