SunTrust 2011 Annual Report Download - page 81
Download and view the complete annual report
Please find page 81 of the 2011 SunTrust annual report below. You can navigate through the pages in the report by either clicking on the pages listed below, or by using the keyword search tool below to find specific information within the annual report.-
 1
1 -
2
-
3
-
4
-
5
-
6
-
7
-
8
-
9
-
10
-
11
-
12
-
13
-
14
-
15
-
16
-
17
-
18
-
19
-
20
-
21
-
22
-
23
-
24
-
25
-
26
-
27
-
28
-
29
-
30
-
31
-
32
-
33
-
34
-
35
-
36
-
37
-
38
-
39
-
40
-
41
-
42
-
43
-
44
-
45
-
46
-
47
-
48
-
49
-
50
-
51
-
52
-
53
-
54
-
55
-
56
-
57
-
58
-
59
-
60
-
61
-
62
-
63
-
64
-
65
-
66
-
67
-
68
-
69
-
70
-
 71
71 -
 72
72 -
 73
73 -
 74
74 -
 75
75 -
 76
76 -
 77
77 -
 78
78 -
 79
79 -
 80
80 -
 81
81 -
 82
82 -
 83
83 -
 84
84 -
 85
85 -
 86
86 -
 87
87 -
 88
88 -
 89
89 -
 90
90 -
 91
91 -
92
-
93
-
94
-
95
-
96
-
97
-
98
-
99
-
100
-
101
-
102
-
103
-
104
-
105
-
106
-
107
-
108
-
109
-
110
-
111
-
112
-
113
-
114
-
115
-
116
-
117
-
118
-
119
-
120
-
121
-
122
-
123
-
124
-
125
-
126
-
127
-
128
-
129
-
130
-
131
-
132
-
133
-
134
-
135
-
136
-
137
-
138
-
139
-
140
-
141
-
142
-
143
-
144
-
145
-
146
-
147
-
148
-
149
-
150
-
151
-
152
-
153
-
154
-
155
-
156
-
157
-
158
-
159
-
160
-
161
-
162
-
163
-
164
-
165
-
166
-
167
-
168
-
169
-
170
-
171
-
172
-
173
-
174
-
175
-
176
-
177
-
178
-
179
-
180
-
181
-
182
-
183
-
184
-
185
-
186
-
187
-
188
-
189
-
190
-
191
-
192
-
193
-
194
-
195
-
196
-
197
-
198
-
199
-
200
-
201
-
202
-
203
-
204
-
205
-
206
-
207
-
208
-
209
-
210
-
211
-
212
-
213
-
214
-
215
-
216
-
217
-
218
-
219
-
220
-
221
-
222
-
223
-
224
-
225
-
226
-
227
 |
 |

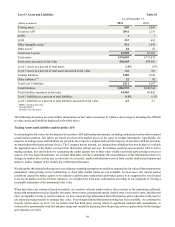
65
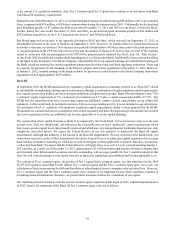
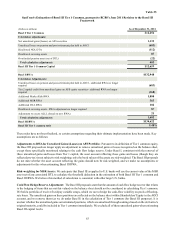
not necessarily reflect the nature and extent of future changes in the ALLL. They are intended to provide insights into the impact
of adverse changes in risk rating and estimated loss severity rates and do not imply any expectation of future deterioration in the
risk ratings or loss rates. Given current processes employed, management believes the risk ratings and inherent loss rates currently
assigned are appropriate. It is possible that others, given the same information, may at any point in time reach different reasonable
conclusions that could be material to our financial statements.
In addition to the ALLL, we also estimate probable losses related to unfunded lending commitments, such as letters of credit and
binding unfunded loan commitments. Unfunded lending commitments are analyzed and segregated by risk similar to funded loans
based on our internal risk rating scale. These risk classifications, in combination with an analysis of historical loss experience,
probability of commitment usage, and any other pertinent information, result in the estimation of the reserve for unfunded lending
commitments.
Our financial results are affected by the changes in and the absolute level of the Allowance for Credit Losses. This process involves
our analysis of complex internal and external variables, and it requires that we exercise judgment to estimate an appropriate
Allowance for Credit Losses. As a result of the uncertainty associated with this subjectivity, we cannot assure the precision of the
amount reserved should we experience sizeable loan or lease losses in any particular period. For example, changes in the financial
condition of individual borrowers, economic conditions, or the condition of various markets in which collateral may be sold could
require us to significantly decrease or increase the level of the Allowance for Credit Losses. Such an adjustment could materially
affect net income as a result of the change in provision for credit losses. During the last three years, we have experienced elevated
delinquencies and net charge-offs in residential real estate loans due to the deterioration of the housing market. These market
conditions were considered in deriving the estimated Allowance for Credit Losses; however, given the continued economic
challenges and uncertainties, the ultimate amount of loss could vary from that estimate. For additional discussion of the ALLL
see the “Allowance for Credit Losses” and “Nonperforming Assets” sections in this MD&A as well as Note 6, “Loans,” and Note
7, “Allowance for Credit Losses,” to the Consolidated Financial Statements in this Form 10-K.
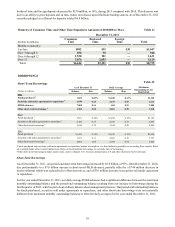
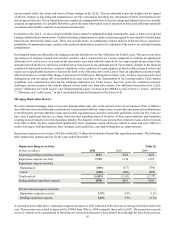
Mortgage Repurchase Reserve
We sell residential mortgage loans to investors through whole loan sales in the normal course of our business. Prior to 2008 we
also sold loans to investors through securitizations. In association with these transactions, we provide representations and warranties
to the third party investors that these loans meet certain requirements as agreed to in investor guidelines. In the last few years, we
have seen a significant increase in claims from investors regarding material breaches of these representations and warranties
resulting in an elevated level in the repurchase liability. The majority of the losses incurred have related to loans sold to investors
from 2005 to 2008. We have experienced significantly fewer repurchase claims and losses related to loans sold since 2009 as a
result of stronger credit performance, more stringent credit guidelines, and underwriting process improvements.
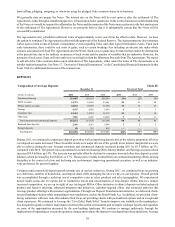
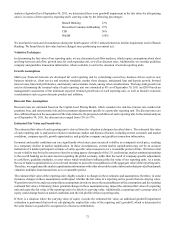
Repurchase requests received since 2005 have totaled $5.3 billion which includes Ginnie Mae repurchase demands. The following
table summarizes demand activity for the years ended December 31:
Repurchase Request Activity
(Dollars in millions)
Beginning pending repurchase requests
Repurchase requests received
Repurchase requests resolved:
Repurchased
Cured
Total resolved
Ending pending repurchase requests
Percent from non-agency investors:
Repurchase requests received
Pending repurchase requests
2011
$293
1,736
(789)
(650)
(1,439)
$590
2.9%
2.0%
2010
$326
1,130
(677)
(486)
(1,163)
$293
4.9%
9.9%
Table 26
2009
$428
1,075
(708)
(469)
(1,177)
$326
9.2%
11.3%
As presented in the table above, repurchase requests increased in 2011 with most of the increase occurring in the latter half of the
year. This increase was related to loans sold to FNMA from 2006 to 2008; primarily those sold in 2007. The repurchase requests
received continue to be concentrated in loans that are seriously delinquent or have already been through the foreclosure process.