SunTrust 2011 Annual Report Download - page 72
Download and view the complete annual report
Please find page 72 of the 2011 SunTrust annual report below. You can navigate through the pages in the report by either clicking on the pages listed below, or by using the keyword search tool below to find specific information within the annual report.-
 1
1 -
2
-
3
-
4
-
5
-
6
-
7
-
8
-
9
-
10
-
11
-
12
-
13
-
14
-
15
-
16
-
17
-
18
-
19
-
20
-
21
-
22
-
23
-
24
-
25
-
26
-
27
-
28
-
29
-
30
-
31
-
32
-
33
-
34
-
35
-
36
-
37
-
38
-
39
-
40
-
41
-
42
-
43
-
44
-
45
-
46
-
47
-
48
-
49
-
50
-
51
-
52
-
53
-
54
-
55
-
56
-
57
-
58
-
59
-
60
-
61
-
 62
62 -
 63
63 -
 64
64 -
 65
65 -
 66
66 -
 67
67 -
 68
68 -
 69
69 -
 70
70 -
 71
71 -
 72
72 -
 73
73 -
 74
74 -
 75
75 -
 76
76 -
 77
77 -
 78
78 -
 79
79 -
 80
80 -
 81
81 -
 82
82 -
83
-
84
-
85
-
86
-
87
-
88
-
89
-
90
-
91
-
92
-
93
-
94
-
95
-
96
-
97
-
98
-
99
-
100
-
101
-
102
-
103
-
104
-
105
-
106
-
107
-
108
-
109
-
110
-
111
-
112
-
113
-
114
-
115
-
116
-
117
-
118
-
119
-
120
-
121
-
122
-
123
-
124
-
125
-
126
-
127
-
128
-
129
-
130
-
131
-
132
-
133
-
134
-
135
-
136
-
137
-
138
-
139
-
140
-
141
-
142
-
143
-
144
-
145
-
146
-
147
-
148
-
149
-
150
-
151
-
152
-
153
-
154
-
155
-
156
-
157
-
158
-
159
-
160
-
161
-
162
-
163
-
164
-
165
-
166
-
167
-
168
-
169
-
170
-
171
-
172
-
173
-
174
-
175
-
176
-
177
-
178
-
179
-
180
-
181
-
182
-
183
-
184
-
185
-
186
-
187
-
188
-
189
-
190
-
191
-
192
-
193
-
194
-
195
-
196
-
197
-
198
-
199
-
200
-
201
-
202
-
203
-
204
-
205
-
206
-
207
-
208
-
209
-
210
-
211
-
212
-
213
-
214
-
215
-
216
-
217
-
218
-
219
-
220
-
221
-
222
-
223
-
224
-
225
-
226
-
227
 |
 |

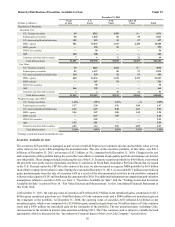
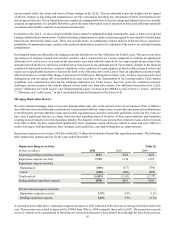
56
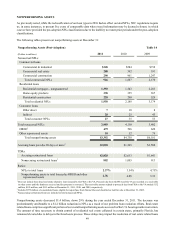
Maturity Distribution of Securities Available for Sale
(Dollars in millions)
Distribution of Maturities:
Amortized Cost
U.S. Treasury securities
Federal agency securities
U.S. states and political subdivisions
MBS - agency
MBS - private
CDO/CLO securities
ABS
Corporate and other debt securities
Total debt securities
Fair Value
U.S. Treasury securities
Federal agency securities
U.S. states and political subdivisions
MBS - agency
MBS - private
CDO/CLO securities
ABS
Corporate and other debt securities
Total debt securities
Weighted average yield (FTE)1:
U.S. Treasury securities
Federal agency securities
U.S. states and political subdivisions
MBS - agency
MBS - private
CDO/CLO securities
ABS
Corporate and other debt securities
Total debt securities
December 31, 2011
1 Year
or Less
$9
88
135
802
—
—
260
7
$1,301
$9
89
138
840
—
—
266
7
$1,349
1.45%
3.37
6.32
3.04
—
—
1.85
4.09
3.30%
1-5
Years
$212
1,620
223
15,833
196
50
200
4
$18,338
$223
1,697
239
16,434
167
50
198
4
$19,012
1.99%
2.30
6.07
3.07
8.27
2.95
3.81
1.14
3.09%
5-10
Years
$450
80
22
1,415
56
—
—
17
$2,040
$462
89
22
1,478
54
—
—
19
$2,124
2.15%
3.92
5.48
3.88
7.87
—
—
5.83
3.65%
After 10
Years
$—
55
57
2,430
—
—
—
21
$2,563
$—
57
55
2,471
—
—
—
21
$2,604
—%
3.89
4.67
3.49
—
—
—
0.05
3.53%
Table 19
Total
$671
1,843
437
20,480
252
50
460
49
$24,242
$694
1,932
454
21,223
221
50
464
51
$25,089
2.09%
2.47
5.93
3.30
8.18
2.95
2.50
4.53
3.18%
1Average yields are based on amortized cost.
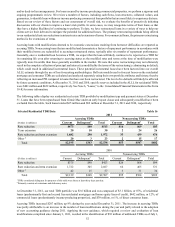
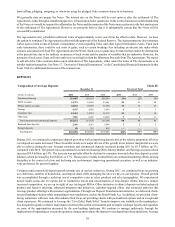
Securities Available for Sale
The securities AFS portfolio is managed as part of our overall ALM process to optimize income and portfolio value over an
entire interest rate cycle while mitigating the associated risks. The size of the securities portfolio, at fair value, was $28.1
billion as of December 31, 2011, an increase of $1.2 billion, or 5%, compared with December 31, 2010. Changes in the size
and composition of the portfolio during the year reflect our efforts to maintain a high quality portfolio and manage our interest
rate risk profile. These changes included reducing the size of the U.S. Treasury securities portfolio by $4.8 billion, from which
the proceeds were partly used to repurchase our Series C and Series D Fixed Rate Cumulative Preferred Stock that we issued
to the U.S. Treasury under the CPP. Over the course of the year, we also increased our agency MBS portfolio by $6.9 billion
in an effort to capture better relative value. During the year ended December 31, 2011, we recorded $117 million in net realized
gains predominantly from the sale of securities AFS as a result of the aforementioned activities in our portfolio, compared
with net realized gains of $191 million during the same period in 2010. For additional information on composition and valuation
assumptions related to securities AFS, see Note 5, "Securities Available for Sale", and the “Trading Assets and Securities
Available for Sale” section of Note 19, “Fair Value Election and Measurement,” to the Consolidated Financial Statements in
this Form 10-K.
At December 31, 2011, the carrying value of securities AFS reflected $2.9 billion in net unrealized gains, comprised of a $2.1
billion gross unrealized gain from our 30 million shares of Coke common stock and a $848 million net unrealized gain on
the remainder of the portfolio. At December 31, 2010, the carrying value of securities AFS reflected $2.4 billion in net
unrealized gains, which were comprised of a $2.0 billion gross unrealized gain from our 30 million shares of Coke common
stock and a $438 million net unrealized gain on the remainder of the portfolio. The net unrealized gain, excluding Coke,
increased due to the decline in interest rates experienced during 2011. The Coke common stock is subject to variable forward
agreements, which is discussed in the “Investment in Common shares of the Coca-Cola Company” section below.