SunTrust 2011 Annual Report Download - page 190
Download and view the complete annual report
Please find page 190 of the 2011 SunTrust annual report below. You can navigate through the pages in the report by either clicking on the pages listed below, or by using the keyword search tool below to find specific information within the annual report.-
 1
1 -
2
-
3
-
4
-
5
-
6
-
7
-
8
-
9
-
10
-
11
-
12
-
13
-
14
-
15
-
16
-
17
-
18
-
19
-
20
-
21
-
22
-
23
-
24
-
25
-
26
-
27
-
28
-
29
-
30
-
31
-
32
-
33
-
34
-
35
-
36
-
37
-
38
-
39
-
40
-
41
-
42
-
43
-
44
-
45
-
46
-
47
-
48
-
49
-
50
-
51
-
52
-
53
-
54
-
55
-
56
-
57
-
58
-
59
-
60
-
61
-
62
-
63
-
64
-
65
-
66
-
67
-
68
-
69
-
70
-
71
-
72
-
73
-
74
-
75
-
76
-
77
-
78
-
79
-
80
-
81
-
82
-
83
-
84
-
85
-
86
-
87
-
88
-
89
-
90
-
91
-
92
-
93
-
94
-
95
-
96
-
97
-
98
-
99
-
100
-
101
-
102
-
103
-
104
-
105
-
106
-
107
-
108
-
109
-
110
-
111
-
112
-
113
-
114
-
115
-
116
-
117
-
118
-
119
-
120
-
121
-
122
-
123
-
124
-
125
-
126
-
127
-
128
-
129
-
130
-
131
-
132
-
133
-
134
-
135
-
136
-
137
-
138
-
139
-
140
-
141
-
142
-
143
-
144
-
145
-
146
-
147
-
148
-
149
-
150
-
151
-
152
-
153
-
154
-
155
-
156
-
157
-
158
-
159
-
160
-
161
-
162
-
163
-
164
-
165
-
166
-
167
-
168
-
169
-
170
-
171
-
172
-
173
-
174
-
175
-
176
-
177
-
178
-
179
-
 180
180 -
 181
181 -
 182
182 -
 183
183 -
 184
184 -
 185
185 -
 186
186 -
 187
187 -
 188
188 -
 189
189 -
 190
190 -
 191
191 -
 192
192 -
 193
193 -
 194
194 -
 195
195 -
 196
196 -
 197
197 -
 198
198 -
 199
199 -
 200
200 -
201
-
202
-
203
-
204
-
205
-
206
-
207
-
208
-
209
-
210
-
211
-
212
-
213
-
214
-
215
-
216
-
217
-
218
-
219
-
220
-
221
-
222
-
223
-
224
-
225
-
226
-
227
 |
 |

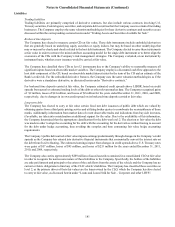
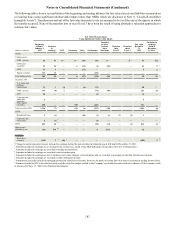
Notes to Consolidated Financial Statements (Continued)
174
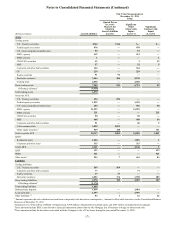
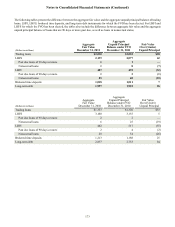
The following tables present the change in fair value during the years ended December 31, 2011, 2010, and 2009 of financial
instruments for which the FVO has been elected, as well as MSRs that are accounted for at fair value in accordance with applicable
fair value accounting guidance. The tables do not reflect the change in fair value attributable to the related economic hedges the
Company used to mitigate the market-related risks associated with the financial instruments. The changes in the fair value of
economic hedges are also recognized in trading income/(loss), mortgage production related (loss)/income, or mortgage servicing
related income, as appropriate, and are designed to partially offset the change in fair value of the financial instruments referenced
in the tables below. The Company’s economic hedging activities are deployed at both the instrument and portfolio level.
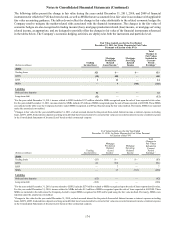
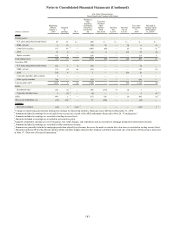
(Dollars in millions)
Assets
Trading loans
LHFS
LHFI
MSRs
Liabilities
Brokered time deposits
Long-term debt
Fair Value Gain/(Loss) for the Year Ended
December 31, 2011, for Items Measured at Fair Value
Pursuant to Election of the FVO
Trading
income/(loss)
$21
(10)
3
—
32
(12)
Mortgage
Production
Related
(Loss)/Income 1
$—
450
11
7
—
—
Mortgage
Servicing
Related
Income
$—
—
—
(733)
—
—
Total
Changes in
Fair Values
Included in
Current-
Period
Earnings 2
$21
440
14
(726)
32
(12)
1For the year ended December 31, 2011, income related to LHFS includes $217 million related to MSRs recognized upon the sale of loans reported at fair value.
For the year ended December 31, 2011, income related to MSRs includes $7 million of MSRs recognized upon the sale of loans reported at LOCOM. These MSRs
are included in the table since the Company elected to report MSRs recognized in 2009 and beyond using the fair value method. Previously, MSRs were reported
under the amortized cost method.
2Changes in fair value for the year ended December 31, 2011, exclude accrued interest for the periods then ended. Interest income or interest expense on trading
loans, LHFS, LHFI, brokered time deposits and long-term debt that have been elected to be carried at fair value are recorded in interest income or interest expense
in the Consolidated Statements of Income/(Loss) based on their contractual coupons.
(Dollars in millions)
Assets
Trading loans
LHFS
LHFI
MSRs
Liabilities
Brokered time deposits
Long-term debt
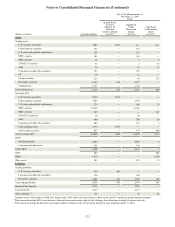
Fair Value Gain/(Loss) for the Year Ended
December 31, 2010, for Items Measured at Fair Value Pursuant
to Election of the FVO
Trading
income/(loss)
($3)
26
—
—
(62)
(168)
Mortgage
Production
Related
(Loss)/
Income 1
$—
568
7
15
—
—
Mortgage
Servicing
Related
Income
$—
—
—
(513)
—
—
Total
Changes in
Fair Values
Included in
Current
Period
Earnings 2
($3)
594
7
(498)
(62)
(168)
1For the year ended December 31, 2010, income related to LHFS, includes $274 million related to MSRs recognized upon the sale of loans reported at fair value.
For the year ended December 31, 2010, income related to MSRs includes $15 million of MSRs recognized upon the sale of loans reported at LOCOM. These
MSRs are included in the table since the Company elected to report MSRs recognized in 2009 and beyond using the fair value method. Previously, MSRs were
reported under the amortized cost method.
2Changes in fair value for the year ended December 31, 2010, exclude accrued interest for the periods then ended. Interest income or interest expense on trading
loans, LHFS, LHFI, brokered time deposits and long-term debt that have been elected to be carried at fair value are recorded in interest income or interest expense
in the Consolidated Statements of Income/(Loss) based on their contractual coupons.