SunTrust 2011 Annual Report Download - page 95
Download and view the complete annual report
Please find page 95 of the 2011 SunTrust annual report below. You can navigate through the pages in the report by either clicking on the pages listed below, or by using the keyword search tool below to find specific information within the annual report.-
 1
1 -
2
-
3
-
4
-
5
-
6
-
7
-
8
-
9
-
10
-
11
-
12
-
13
-
14
-
15
-
16
-
17
-
18
-
19
-
20
-
21
-
22
-
23
-
24
-
25
-
26
-
27
-
28
-
29
-
30
-
31
-
32
-
33
-
34
-
35
-
36
-
37
-
38
-
39
-
40
-
41
-
42
-
43
-
44
-
45
-
46
-
47
-
48
-
49
-
50
-
51
-
52
-
53
-
54
-
55
-
56
-
57
-
58
-
59
-
60
-
61
-
62
-
63
-
64
-
65
-
66
-
67
-
68
-
69
-
70
-
71
-
72
-
73
-
74
-
75
-
76
-
77
-
78
-
79
-
80
-
81
-
82
-
83
-
84
-
 85
85 -
 86
86 -
 87
87 -
 88
88 -
 89
89 -
 90
90 -
 91
91 -
 92
92 -
 93
93 -
 94
94 -
 95
95 -
 96
96 -
 97
97 -
 98
98 -
 99
99 -
 100
100 -
 101
101 -
 102
102 -
 103
103 -
 104
104 -
 105
105 -
106
-
107
-
108
-
109
-
110
-
111
-
112
-
113
-
114
-
115
-
116
-
117
-
118
-
119
-
120
-
121
-
122
-
123
-
124
-
125
-
126
-
127
-
128
-
129
-
130
-
131
-
132
-
133
-
134
-
135
-
136
-
137
-
138
-
139
-
140
-
141
-
142
-
143
-
144
-
145
-
146
-
147
-
148
-
149
-
150
-
151
-
152
-
153
-
154
-
155
-
156
-
157
-
158
-
159
-
160
-
161
-
162
-
163
-
164
-
165
-
166
-
167
-
168
-
169
-
170
-
171
-
172
-
173
-
174
-
175
-
176
-
177
-
178
-
179
-
180
-
181
-
182
-
183
-
184
-
185
-
186
-
187
-
188
-
189
-
190
-
191
-
192
-
193
-
194
-
195
-
196
-
197
-
198
-
199
-
200
-
201
-
202
-
203
-
204
-
205
-
206
-
207
-
208
-
209
-
210
-
211
-
212
-
213
-
214
-
215
-
216
-
217
-
218
-
219
-
220
-
221
-
222
-
223
-
224
-
225
-
226
-
227
 |
 |

79
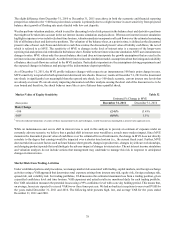
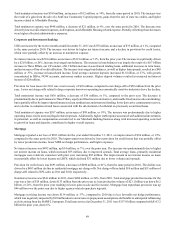
Value at Risk Profile
(Dollars in millions)
Average VAR
High VAR
Low VAR
Year Ended December 31
2011
$5
$7
$3
Table 33
2010
$9
$15
$6
Average VAR during the year ended December 31, 2011 was lower compared to the year ended December 31, 2010 primarily due
to sales, paydowns, and maturities of illiquid trading assets. This is a result of continuing to manage down illiquid asset holdings
where possible, as they are not part of our core business activities. While VAR can be a useful risk management tool, it does have
inherent limitations including the assumption that past market behavior is indicative of future market performance. As such, VAR
is only one of several tools used to manage trading risk. Specifically, scenario analysis, stress testing, profit and loss attribution,
and stop loss limits are among other tools also used to actively manage trading risk.
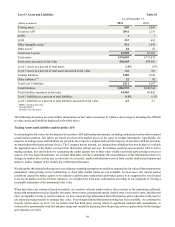
Trading assets, net of trading liabilities, averaged $3.9 billion and $3.5 billion for the years ended December 31, 2011 and 2010,
respectively. Trading assets, net of trading liabilities, were $4.5 billion and $3.5 billion at December 31, 2011 and 2010, respectively.
The increase in average and as of trading balances was primarily a result of an increase in the TRS portfolio and growth in fixed
income trading, but partially offset by reductions in illiquid trading asset holdings.
Liquidity Risk
Liquidity risk is the risk of being unable to meet obligations as they come due at a reasonable funding cost. We mitigate this risk
by structuring our balance sheet prudently and by maintaining diverse borrowing resources to fund potential cash needs. For
example, we structure our balance sheet so that we fund less liquid assets, such as loans, with stable funding sources, such as retail
and wholesale deposits, long-term debt, and capital. We primarily monitor and manage liquidity risk at the Parent Company and
Bank levels as the non-bank subsidiaries are relatively small and these subsidiaries ultimately rely upon the Parent Company as
a source of liquidity in adverse environments.
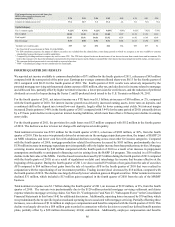
The Bank’s primary liquid assets consist of excess reserves and free and liquid securities in its investment portfolio. The Bank
manages its investment portfolio primarily as a source of liquidity, maintaining the strong majority of its securities in liquid and
high-grade asset classes such as agency MBS, agency debt, and U.S. Treasury securities. As of December 31, 2011, the Bank’s
AFS investment portfolio contained $12.6 billion of free and liquid securities at book value, of which approximately 94% consisted
of agency MBS, agency debt, and U.S. Treasury securities.
Some fair value assets are pledged for corporate borrowings or other liquidity purposes. Most of these arrangements provide for
advances to be made based on the market value and not the principal balance of the assets, and therefore, whether or not we have
elected fair value accounting treatment does not impact our liquidity. If the fair value of assets posted as collateral declines, we
will be required to post more collateral under our borrowing arrangements which could negatively impact our liquidity position
on an overall basis. For purposes of computing regulatory capital, mark to market adjustments related to our own creditworthiness
for debt and index linked CDs, accounted for at fair value, are excluded from regulatory capital.
We manage the Parent Company to maintain most of its liquid assets in cash and securities that could be quickly converted to
cash. Unlike the Bank, it is not typical for the Parent Company to maintain a portfolio of publicly traded securities. However, prior
to retiring the preferred stock issued to the U.S. Treasury in March 2011, the Parent Company invested approximately $5 billion
of cash in a portfolio of U.S. Treasury securities. We manage the Parent Company cash balance to provide sufficient liquidity to
fund all forecasted obligations (primarily debt and capital related) for an extended period of months in accordance with Company
risk limits.
We assess liquidity needs that may occur in both the normal course of business and times of unusual events, considering both on
and off-balance sheet arrangements and commitments that may impact liquidity in certain business environments. We have
contingency funding plans that assess liquidity needs that may arise from certain stress events such as credit rating downgrades,
severe economic recessions, and financial market disruptions. Our contingency plans also provide for continuous monitoring of
net borrowed funds dependence and available sources of contingent liquidity. These sources of contingent liquidity include available
cash reserves; the ability to sell, pledge, or borrow against unencumbered securities in the Bank’s investment portfolio; capacity
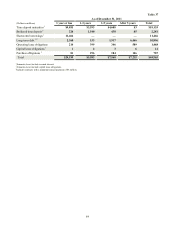
to borrow from the FHLB system; and the capacity to borrow at the Federal Reserve discount window. The table below presents
period-end and average balances from these four sources as of and for the year ended December 31, 2011 and 2010. We believe
these contingent liquidity sources exceed any contingent liquidity needs.