SunTrust 2011 Annual Report Download - page 49
Download and view the complete annual report
Please find page 49 of the 2011 SunTrust annual report below. You can navigate through the pages in the report by either clicking on the pages listed below, or by using the keyword search tool below to find specific information within the annual report.-
 1
1 -
2
-
3
-
4
-
5
-
6
-
7
-
8
-
9
-
10
-
11
-
12
-
13
-
14
-
15
-
16
-
17
-
18
-
19
-
20
-
21
-
22
-
23
-
24
-
25
-
26
-
27
-
28
-
29
-
30
-
31
-
32
-
33
-
34
-
35
-
36
-
37
-
38
-
 39
39 -
 40
40 -
 41
41 -
 42
42 -
 43
43 -
 44
44 -
 45
45 -
 46
46 -
 47
47 -
 48
48 -
 49
49 -
 50
50 -
 51
51 -
 52
52 -
 53
53 -
 54
54 -
 55
55 -
 56
56 -
 57
57 -
 58
58 -
 59
59 -
60
-
61
-
62
-
63
-
64
-
65
-
66
-
67
-
68
-
69
-
70
-
71
-
72
-
73
-
74
-
75
-
76
-
77
-
78
-
79
-
80
-
81
-
82
-
83
-
84
-
85
-
86
-
87
-
88
-
89
-
90
-
91
-
92
-
93
-
94
-
95
-
96
-
97
-
98
-
99
-
100
-
101
-
102
-
103
-
104
-
105
-
106
-
107
-
108
-
109
-
110
-
111
-
112
-
113
-
114
-
115
-
116
-
117
-
118
-
119
-
120
-
121
-
122
-
123
-
124
-
125
-
126
-
127
-
128
-
129
-
130
-
131
-
132
-
133
-
134
-
135
-
136
-
137
-
138
-
139
-
140
-
141
-
142
-
143
-
144
-
145
-
146
-
147
-
148
-
149
-
150
-
151
-
152
-
153
-
154
-
155
-
156
-
157
-
158
-
159
-
160
-
161
-
162
-
163
-
164
-
165
-
166
-
167
-
168
-
169
-
170
-
171
-
172
-
173
-
174
-
175
-
176
-
177
-
178
-
179
-
180
-
181
-
182
-
183
-
184
-
185
-
186
-
187
-
188
-
189
-
190
-
191
-
192
-
193
-
194
-
195
-
196
-
197
-
198
-
199
-
200
-
201
-
202
-
203
-
204
-
205
-
206
-
207
-
208
-
209
-
210
-
211
-
212
-
213
-
214
-
215
-
216
-
217
-
218
-
219
-
220
-
221
-
222
-
223
-
224
-
225
-
226
-
227
 |
 |
33
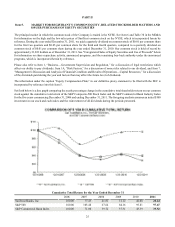
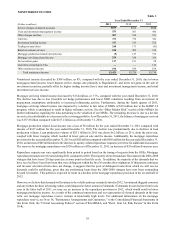
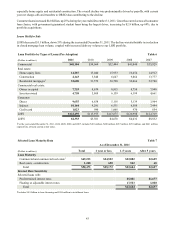
historical standards at 2.01% of total loans and declined 57 basis points and 75 basis points compared to December 31, 2010
and 2009, respectively, in part due to decreases in the ALLL during 2011 and 2010, coupled with an increase in loans. The
improvement in credit quality drove a 44% and 62% decrease in the provision for loan losses compared to 2010 and 2009,
respectively. Additionally, net charge-offs declined 29% and 37% compared to 2010 and 2009, respectively. We currently
expect net charge-offs to be stable to modestly down during the first quarter of 2012. Total NPLs continued the downward
trend that began in 2010, with a decline of 29% from December 31, 2010 as a result of reduced inflows into nonaccrual
combined with our problem loan resolution efforts. NPLs are also down 46% compared to December 31, 2009. We expect
a continuation of the 2011 trend in NPLs with additional declines in the first quarter of 2012. OREO declined 20% during
the year and 23% compared to December 31, 2009. The declines since year end 2010 and 2009 were the result of disposition
of properties once we had clear title, coupled with a slow down of inflows. Our restructured loan portfolio is relatively
unchanged in total compared to December 31, 2010, with a decrease in the nonaccruing loans offset by an increase in the
accruing loan population. However, the restructured loan population has grown by 42% since December 31, 2009 as a result
of our efforts for clients who were experiencing financial difficulty to restructure their loan to avoid foreclosure. As a result,
our accruing restructured loan portfolio, which is primarily mortgage and consumer loans, increased by 8% and 72% compared
to December 31, 2010 and 2009, respectively. However, the portfolio continued to exhibit strong payment performance with
88% current on principal and interest payments at December 31, 2011. Early stage delinquencies, a leading indicator of asset
quality, particularly for consumer loans, remained stable this year, however, when excluding government-guaranteed loan
delinquencies, early stage delinquencies declined 22 basis points from December 31, 2010. This decline was a result of our
efforts to reduce risk in the portfolio during the year as evidenced by a decline in higher-risk loans coupled with the growth
of government-guaranteed loans. See additional discussion of credit and asset quality in the “Loans,” “Allowance for Credit
Losses,” “Nonperforming Assets,” and “Restructured Loans,” sections of this MD&A.
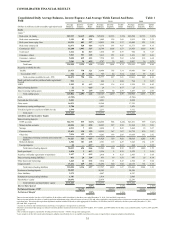
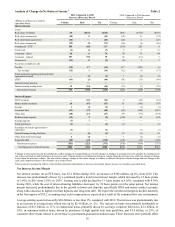
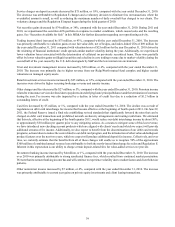
Average loans increased by $2.4 billion, or 2%, during the year, with increases in commercial & industrial and consumer
loans being partially offset by decreases in residential and commercial real estate loans. The total average loan balances have
only increased modestly from 2010, but our risk profile has improved noticeably as we made progress on diversifying the
portfolio and reducing risk. Our efforts in 2011 resulted in a decline in certain higher-risk loan portfolios, which have been
offset by targeted growth in certain lower-risk portfolios, such as government-guaranteed loans. As a result, our guaranteed
loans represent 11% of the portfolio as of December 31, 2011 compared to 8% at December 31, 2010. A major driver of the
increase in government guaranteed loans has been the purchase of guaranteed loan portfolios. While our decision to purchase
government guaranteed loans has benefited us in the current economic cycle, as the economy grows and organic loan growth
increases, we expect slower growth of our government guaranteed portfolios in the future. Additionally, despite continued
soft overall loan demand, we remain committed to providing home financing in the communities we serve and are focused
on extending credit to qualified borrowers during this uncertain economic landscape. To that end, during the year ended
December 31, 2011, we extended approximately $84 billion in new loan originations, commitments, and renewals of
commercial, residential, and consumer loans to our clients.
Client deposit growth continued its positive trajectory, reaching record highs during 2011, and the positive shift in deposit
mix continued with lower-cost deposit increases more than offsetting the decline in higher-cost deposits. Average consumer
and commercial deposits increased 5% during 2011, led by average balance increases of 19% in lower cost noninterest-bearing
DDAs, predominantly offset by declines in higher cost CDs of 17%. Due to the growth seen in core deposits, our liquidity
has been enhanced, enabling us to reduce our higher-cost funding sources, helping to drive significant reductions in our
funding costs. While we continue to believe that a portion of the low-cost deposit growth is attributable to clients’ desires
for having increased liquidity, we believe that we have also proactively generated this growth in both our Consumer and
Wholesale business, as we have expanded the number of primary client relationships and improved our client loyalty.
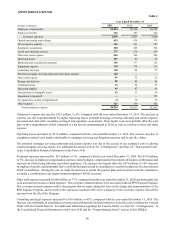
Our client-focused revenue generation strategies, lower cost funding mix, and improved asset quality contributed to improved
operating trends as seen in higher net interest income and lower provision for credit losses, partially offset by higher noninterest
expenses compared to a year ago. Total revenue, on an FTE basis, declined 1% compared to 2010, but increased 4% from
2009. The change compared to 2010 was primarily due to an increase in net interest income offset by a decline in noninterest
income as a result of lower mortgage-related income, lower service charge income, and lower securities gains. The increase
compared to 2009 was due primarily to an increase in net interest income, partially offset by a decline in noninterest income
as a result of less service charges and mortgage-related income. Net interest income, on an FTE basis, increased 4% during
2011 and 13% compared to 2009. The increase in net interest income was due to lower funding costs and an improved funding
mix. As a result, our net interest margin increased to 3.50% for the year ended December 31, 2011 from 3.38% during the
same period in 2010, and 3.04% during 2009. Noninterest income declined 8% compared to 2010, most notably due to
decreases in mortgage-related income, service charge income, and lower securities gains, partially offset by higher trading
income driven by higher valuation gains on our fair value debt and index-linked CDs. Compared to 2009, noninterest income
declined 8%, with increases in trading income, card fees, investment banking income, and trust income, offset by declines in
mortgage-related income, service charge income, and the 2009 gain on sale of Visa share ownership. The driver for the decline
in mortgage-related income compared to both earlier years was primarily due to less favorable net hedge performance and
lower loan production volume that resulted in lower gain on sale and fee income. Service charge income declined compared