SunTrust 2011 Annual Report Download - page 70
Download and view the complete annual report
Please find page 70 of the 2011 SunTrust annual report below. You can navigate through the pages in the report by either clicking on the pages listed below, or by using the keyword search tool below to find specific information within the annual report.-
 1
1 -
2
-
3
-
4
-
5
-
6
-
7
-
8
-
9
-
10
-
11
-
12
-
13
-
14
-
15
-
16
-
17
-
18
-
19
-
20
-
21
-
22
-
23
-
24
-
25
-
26
-
27
-
28
-
29
-
30
-
31
-
32
-
33
-
34
-
35
-
36
-
37
-
38
-
39
-
40
-
41
-
42
-
43
-
44
-
45
-
46
-
47
-
48
-
49
-
50
-
51
-
52
-
53
-
54
-
55
-
56
-
57
-
58
-
59
-
 60
60 -
 61
61 -
 62
62 -
 63
63 -
 64
64 -
 65
65 -
 66
66 -
 67
67 -
 68
68 -
 69
69 -
 70
70 -
 71
71 -
 72
72 -
 73
73 -
 74
74 -
 75
75 -
 76
76 -
 77
77 -
 78
78 -
 79
79 -
 80
80 -
81
-
82
-
83
-
84
-
85
-
86
-
87
-
88
-
89
-
90
-
91
-
92
-
93
-
94
-
95
-
96
-
97
-
98
-
99
-
100
-
101
-
102
-
103
-
104
-
105
-
106
-
107
-
108
-
109
-
110
-
111
-
112
-
113
-
114
-
115
-
116
-
117
-
118
-
119
-
120
-
121
-
122
-
123
-
124
-
125
-
126
-
127
-
128
-
129
-
130
-
131
-
132
-
133
-
134
-
135
-
136
-
137
-
138
-
139
-
140
-
141
-
142
-
143
-
144
-
145
-
146
-
147
-
148
-
149
-
150
-
151
-
152
-
153
-
154
-
155
-
156
-
157
-
158
-
159
-
160
-
161
-
162
-
163
-
164
-
165
-
166
-
167
-
168
-
169
-
170
-
171
-
172
-
173
-
174
-
175
-
176
-
177
-
178
-
179
-
180
-
181
-
182
-
183
-
184
-
185
-
186
-
187
-
188
-
189
-
190
-
191
-
192
-
193
-
194
-
195
-
196
-
197
-
198
-
199
-
200
-
201
-
202
-
203
-
204
-
205
-
206
-
207
-
208
-
209
-
210
-
211
-
212
-
213
-
214
-
215
-
216
-
217
-
218
-
219
-
220
-
221
-
222
-
223
-
224
-
225
-
226
-
227
 |
 |
54
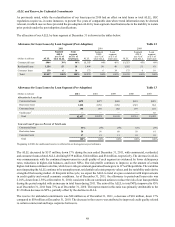
by the declining interest rate environment. This increase was offset by $1.0 billion in cash collateral as a result of our ability
to offset the derivatives with the related collateral. In 2010 and 2009, the cash collateral was classified in other short-term
borrowings in the Consolidated Balance Sheets. See Note 17, "Derivative Financial Instruments," and Note 19 , "Fair Value
Election and Measurement," to the Consolidated Financial Statements in this Form 10-K for more information.
Certain illiquid securities were purchased during the fourth quarter of 2007 from affiliates, which included SIVs that are
collateralized by various domestic and foreign assets, residential MBS, including Alt-A and subprime collateral, CDOs, and
commercial loans, as well as senior interests retained from SunTrust-sponsored securitizations. During the first quarter of
2011, we recognized approximately $17 million in net market valuation gains related to these securities and received
approximately $77 million in cash from sales and paydowns related to these securities, thereby eliminating our exposure to
these distressed assets.
The Company also purchased ARS primarily in the fourth quarter of 2008 and first quarter of 2009 as a result of FINRA
actions and additional ARS in 2011 as a result of claims unrelated to the FINRA actions. See additional discussion related to
ARS matters in Note 20, “Contingencies.” The fair value of ARS recorded in trading assets and included in Table 17 above
declined to $48 million as of December 31, 2011, compared to $147 million as of December 31, 2010. The reduction was due
predominantly to issuer redemptions of all of the remaining preferred equity ARS, offset by additional purchases and a gain
in fair value of the CDO ARS. The remaining ARS includes trading securities purchased as a result of FINRA actions and are
predominantly CDOs collateralized by trust preferred bank debt.
Trading liabilities decreased $872 million, or 33%, since December 31, 2010, predominantly due to a decrease in corporate
and other debt securities as a result of normal changes in trading portfolio product mix and a decrease in derivative contracts
due to offsetting cash collateral. The decrease was partially offset by an increase in U.S. Treasury securities due to normal
business activity. Gross derivative liabilities increased $452 million primarily due to the increase in the fixed income portfolio
driven by the declining interest rate environment. This increase was offset by $1.2 billion in cash collateral as a result of our
ability to offset the derivatives with the related collateral. In 2010 and 2009, the cash collateral was classified in other assets
in the Consolidated Balance Sheets. See Note 17, "Derivative Financial Instruments," and Note 19, "Fair Value Election and
Measurement," to the Consolidated Financial Statements in this Form 10-K for more information.
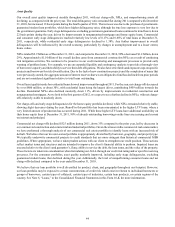
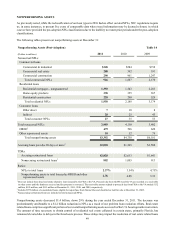
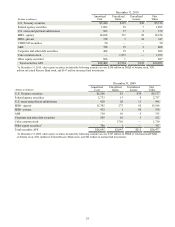
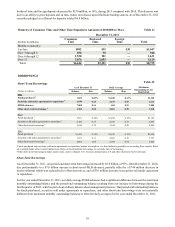
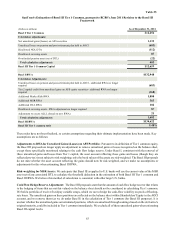
Securities Available for Sale
(Dollars in millions)
U.S. Treasury securities
Federal agency securities
U.S. states and political subdivisions
MBS - agency
MBS - private
CDO/CLO securities
ABS
Corporate and other debt securities
Coke common stock
Other equity securities1
Total securities AFS
December 31, 2011
Amortized
Cost
$671
1,843
437
20,480
252
50
460
49
—
928
$25,170
Unrealized
Gains
$23
89
21
743
—
—
11
2
2,099
1
$2,989
Unrealized
Losses
$—
—
4
—
31
—
7
—
—
—
$42
Table 18
Fair
Value
$694
1,932
454
21,223
221
50
464
51
2,099
929
$28,117
1At December 31, 2011, other equity securities included the following securities at cost: $342 million in FHLB of Atlanta stock, $398
million in Federal Reserve Bank stock, and $187 million in mutual fund investments.