SunTrust 2011 Annual Report Download - page 69
Download and view the complete annual report
Please find page 69 of the 2011 SunTrust annual report below. You can navigate through the pages in the report by either clicking on the pages listed below, or by using the keyword search tool below to find specific information within the annual report.-
 1
1 -
2
-
3
-
4
-
5
-
6
-
7
-
8
-
9
-
10
-
11
-
12
-
13
-
14
-
15
-
16
-
17
-
18
-
19
-
20
-
21
-
22
-
23
-
24
-
25
-
26
-
27
-
28
-
29
-
30
-
31
-
32
-
33
-
34
-
35
-
36
-
37
-
38
-
39
-
40
-
41
-
42
-
43
-
44
-
45
-
46
-
47
-
48
-
49
-
50
-
51
-
52
-
53
-
54
-
55
-
56
-
57
-
58
-
 59
59 -
 60
60 -
 61
61 -
 62
62 -
 63
63 -
 64
64 -
 65
65 -
 66
66 -
 67
67 -
 68
68 -
 69
69 -
 70
70 -
 71
71 -
 72
72 -
 73
73 -
 74
74 -
 75
75 -
 76
76 -
 77
77 -
 78
78 -
 79
79 -
80
-
81
-
82
-
83
-
84
-
85
-
86
-
87
-
88
-
89
-
90
-
91
-
92
-
93
-
94
-
95
-
96
-
97
-
98
-
99
-
100
-
101
-
102
-
103
-
104
-
105
-
106
-
107
-
108
-
109
-
110
-
111
-
112
-
113
-
114
-
115
-
116
-
117
-
118
-
119
-
120
-
121
-
122
-
123
-
124
-
125
-
126
-
127
-
128
-
129
-
130
-
131
-
132
-
133
-
134
-
135
-
136
-
137
-
138
-
139
-
140
-
141
-
142
-
143
-
144
-
145
-
146
-
147
-
148
-
149
-
150
-
151
-
152
-
153
-
154
-
155
-
156
-
157
-
158
-
159
-
160
-
161
-
162
-
163
-
164
-
165
-
166
-
167
-
168
-
169
-
170
-
171
-
172
-
173
-
174
-
175
-
176
-
177
-
178
-
179
-
180
-
181
-
182
-
183
-
184
-
185
-
186
-
187
-
188
-
189
-
190
-
191
-
192
-
193
-
194
-
195
-
196
-
197
-
198
-
199
-
200
-
201
-
202
-
203
-
204
-
205
-
206
-
207
-
208
-
209
-
210
-
211
-
212
-
213
-
214
-
215
-
216
-
217
-
218
-
219
-
220
-
221
-
222
-
223
-
224
-
225
-
226
-
227
 |
 |

53
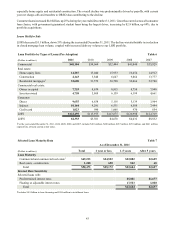
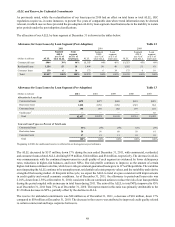
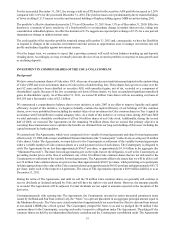
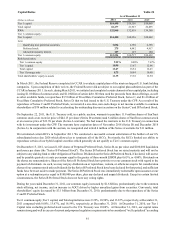
2011, which is the date the guidance became effective. Nonaccruing TDRs decreased by $203 million, down 20% during the
year ended December 31, 2011, primarily reflecting net charge-offs during the year, as well as returns of commercial TDRs
to accrual status and repayments. See additional discussion in Note 1, "Significant Accounting Policies," and Note 6, "Loans,"
to the Consolidated Financial Statements in this Form 10-K.
Interest income on restructured loans that have met sustained performance criteria and have been returned to accruing status
is recognized according to the terms of the restructuring. Such interest income recorded was $111 million and $92 million
for the years ended December 31, 2011 and 2010, respectively. If all such loans had been accruing interest according to their
original contractual terms, estimated interest income of $149 million and $125 million for the years ended December 31, 2011
and 2010, respectively, would have been recognized.
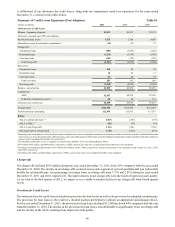
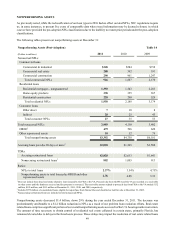
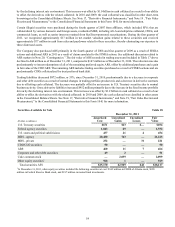
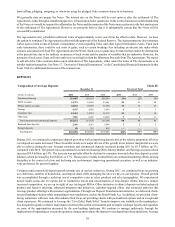
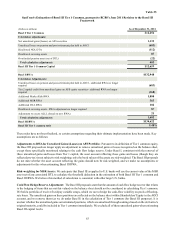
SELECTED FINANCIAL INSTRUMENTS CARRIED AT FAIR VALUE
The following is a discussion of the more significant financial assets and financial liabilities that are currently carried at fair
value on the Consolidated Balance Sheets at December 31, 2011 and 2010. For a complete discussion of our fair value elections
and the methodologies used to estimate the fair values of our financial instruments, refer to Note 19, “Fair Value Election and
Measurement,” to the Consolidated Financial Statements in this Form 10-K.
Trading Assets and Liabilities
(Dollars in millions)
Trading Assets
U.S. Treasury securities
Federal agency securities
U.S. states and political subdivisions
MBS - agency
MBS - private
CDO/CLO securities
ABS
Corporate and other debt securities
CP
Equity securities
Derivative contracts 1
Trading loans
Total trading assets
Trading Liabilities
U.S. Treasury securities
MBS - agency
Corporate and other debt securities
Equity securities
Derivative contracts 1
Total trading liabilities
As of December 31
2011
$144
478
54
412
1
45
37
344
229
91
2,414
2,030
$6,279
$569
—
77
37
1,123
$1,806
2010
$187
361
123
301
15
55
59
743
14
221
2,743
1,353
$6,175
$439
—
398
—
1,841
$2,678
Table 17
2009
$499
474
59
94
6
175
51
466
1
256
2,610
289
$4,980
$190
3
144
8
1,844
$2,189
1The current year amount is offset with cash collateral received from or deposited with derivative counterparties when the derivative contracts are subject
to ISDA master netting arrangements. We made this change during 2011 due to resolution of certain operational limitations. This presentation is in accordance
with applicable accounting standards and applied prospectively.
Trading Assets and Liabilities
Trading assets increased $104 million, or 2%, since December 31, 2010. This increase was primarily driven by normal changes
in trading portfolio product mix resulting in higher federal agency securities, agency MBS, CP and trading loans. The increase
was predominantly offset by a decrease in corporate and other debt securities, a decrease in equity securities due primarily
to issuer redemptions of ARS municipal fund preferred shares, and a decrease in derivative contracts due to offsetting cash
collateral. Gross derivative assets increased $701 million primarily due to the increase in the fixed income portfolio driven