SunTrust 2011 Annual Report Download - page 64
Download and view the complete annual report
Please find page 64 of the 2011 SunTrust annual report below. You can navigate through the pages in the report by either clicking on the pages listed below, or by using the keyword search tool below to find specific information within the annual report.-
 1
1 -
2
-
3
-
4
-
5
-
6
-
7
-
8
-
9
-
10
-
11
-
12
-
13
-
14
-
15
-
16
-
17
-
18
-
19
-
20
-
21
-
22
-
23
-
24
-
25
-
26
-
27
-
28
-
29
-
30
-
31
-
32
-
33
-
34
-
35
-
36
-
37
-
38
-
39
-
40
-
41
-
42
-
43
-
44
-
45
-
46
-
47
-
48
-
49
-
50
-
51
-
52
-
53
-
 54
54 -
 55
55 -
 56
56 -
 57
57 -
 58
58 -
 59
59 -
 60
60 -
 61
61 -
 62
62 -
 63
63 -
 64
64 -
 65
65 -
 66
66 -
 67
67 -
 68
68 -
 69
69 -
 70
70 -
 71
71 -
 72
72 -
 73
73 -
 74
74 -
75
-
76
-
77
-
78
-
79
-
80
-
81
-
82
-
83
-
84
-
85
-
86
-
87
-
88
-
89
-
90
-
91
-
92
-
93
-
94
-
95
-
96
-
97
-
98
-
99
-
100
-
101
-
102
-
103
-
104
-
105
-
106
-
107
-
108
-
109
-
110
-
111
-
112
-
113
-
114
-
115
-
116
-
117
-
118
-
119
-
120
-
121
-
122
-
123
-
124
-
125
-
126
-
127
-
128
-
129
-
130
-
131
-
132
-
133
-
134
-
135
-
136
-
137
-
138
-
139
-
140
-
141
-
142
-
143
-
144
-
145
-
146
-
147
-
148
-
149
-
150
-
151
-
152
-
153
-
154
-
155
-
156
-
157
-
158
-
159
-
160
-
161
-
162
-
163
-
164
-
165
-
166
-
167
-
168
-
169
-
170
-
171
-
172
-
173
-
174
-
175
-
176
-
177
-
178
-
179
-
180
-
181
-
182
-
183
-
184
-
185
-
186
-
187
-
188
-
189
-
190
-
191
-
192
-
193
-
194
-
195
-
196
-
197
-
198
-
199
-
200
-
201
-
202
-
203
-
204
-
205
-
206
-
207
-
208
-
209
-
210
-
211
-
212
-
213
-
214
-
215
-
216
-
217
-
218
-
219
-
220
-
221
-
222
-
223
-
224
-
225
-
226
-
227
 |
 |

48
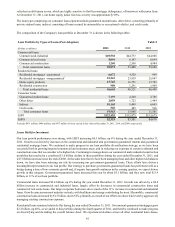
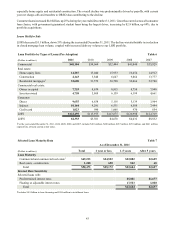
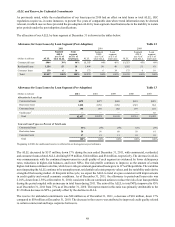
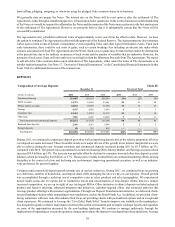
ALLL and Reserve for Unfunded Commitments
As previously noted, while the reclassification of our loan types in 2010 had no effect on total loans or total ALLL, SEC
regulations require us, in some instances, to present five years of comparable data where trend information may be deemed
relevant, in which case we have provided the pre-adoption ALLL by loan segment classifications due to the inability to restate
prior periods under the post-adoption classifications.
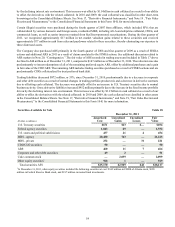
The allocation of our ALLL by loan segment at December 31 is shown in the tables below:
Allowance for Loan Losses by Loan Segment (Post-Adoption)
(Dollars in millions)
Commercial loans
Residential loans
Consumer loans
Total
2011
ALLL
$964
1,354
139
$2,457
Segment
ALLL
as a % of
total ALLL
39%
55
6
100%
Loan
segment
as a % of
total loans
46%
38
16
100%
2010
ALLL
$1,303
1,498
173
$2,974
Segment
ALLL
as a % of
total ALLL
44%
50
6
100%
Loan
segment
as a % of
total loans
46%
40
14
100%
2009
ALLL
$1,353
1,592
175
$3,120
Table 12
Segment
ALLL
as a % of
total ALLL
43%
51
6
100%
Loan
segment
as a % of
total loans
49%
41
10
100%
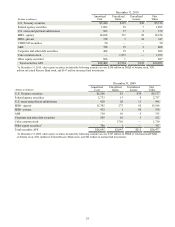
Allowance for Loan Losses by Loan Segment (Pre-Adoption)
(Dollars in millions)
Allocation by Loan Type
Commercial loans
Real estate loans
Consumer loans
Unallocated 1
Total
Year-end Loan Types as a Percent of Total Loans
Commercial loans
Real estate loans
Consumer loans
Total
2011
$479
1,820
158
—
$2,457
33%
50
17
100%
2010
$477
2,238
259
—
$2,974
29%
56
15
100%
2009
$650
2,268
202
—
$3,120
29%
60
11
100%
2008
$631
1,523
197
—
$2,351
32%
58
10
100%
Table 13
2007
$423
664
110
85
$1,282
29%
61
10
100%
1Beginning in 2008, the unallocated reserve is reflected in our homogeneous pool estimates.
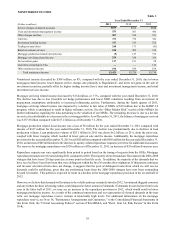
The ALLL decreased by $517 million, down 17% during the year ended December 31, 2011, with commercial, residential,
and consumer loans-related ALLL declining $339 million, $144 million, and $34 million, respectively. The decrease in ALLL
was commensurate with the continued improvement in credit quality of each segment as evidenced by lower delinquency
rates, reductions in higher-risk balances, and lower NPLs. Our risk profile continues to improve, as the amount of certain
higher-risk loans continue to decline, while lower-risk government guaranteed loans grew to 11% of the portfolio. The variables
most impacting the ALLL continue to be unemployment, residential real estate property values, and the variability and relative
strength of the housing market. At this point in the cycle, we expect the ALLL to trend at a pace consistent with improvements
in credit quality and overall economic conditions. As of December 31, 2011, the allowance to period-end loans ratio was
2.01%, down from 2.58% at December 31, 2010, consistent with our continued actions to reduce the risk of our loan portfolio
during the period coupled with an increase in total loans during 2011. The ratio of the ALLL to total NPLs improved to 85%
as of December 31, 2011 from 73% as of December 31, 2010. The improvement in this ratio was primarily attributable to the
$1.2 billion decrease in NPLs, partially offset by the decline in ALLL.
The reserve for unfunded commitments was $48 million as of December 31, 2011, a decrease of $10 million, down 17%
compared to $58 million at December 31, 2010. The decrease in the reserve was attributed to improved credit quality related
to certain commercial and large corporate borrowers.