SunTrust 2011 Annual Report Download - page 102
Download and view the complete annual report
Please find page 102 of the 2011 SunTrust annual report below. You can navigate through the pages in the report by either clicking on the pages listed below, or by using the keyword search tool below to find specific information within the annual report.-
 1
1 -
2
-
3
-
4
-
5
-
6
-
7
-
8
-
9
-
10
-
11
-
12
-
13
-
14
-
15
-
16
-
17
-
18
-
19
-
20
-
21
-
22
-
23
-
24
-
25
-
26
-
27
-
28
-
29
-
30
-
31
-
32
-
33
-
34
-
35
-
36
-
37
-
38
-
39
-
40
-
41
-
42
-
43
-
44
-
45
-
46
-
47
-
48
-
49
-
50
-
51
-
52
-
53
-
54
-
55
-
56
-
57
-
58
-
59
-
60
-
61
-
62
-
63
-
64
-
65
-
66
-
67
-
68
-
69
-
70
-
71
-
72
-
73
-
74
-
75
-
76
-
77
-
78
-
79
-
80
-
81
-
82
-
83
-
84
-
85
-
86
-
87
-
88
-
89
-
90
-
91
-
 92
92 -
 93
93 -
 94
94 -
 95
95 -
 96
96 -
 97
97 -
 98
98 -
 99
99 -
 100
100 -
 101
101 -
 102
102 -
 103
103 -
 104
104 -
 105
105 -
 106
106 -
 107
107 -
 108
108 -
 109
109 -
 110
110 -
 111
111 -
 112
112 -
113
-
114
-
115
-
116
-
117
-
118
-
119
-
120
-
121
-
122
-
123
-
124
-
125
-
126
-
127
-
128
-
129
-
130
-
131
-
132
-
133
-
134
-
135
-
136
-
137
-
138
-
139
-
140
-
141
-
142
-
143
-
144
-
145
-
146
-
147
-
148
-
149
-
150
-
151
-
152
-
153
-
154
-
155
-
156
-
157
-
158
-
159
-
160
-
161
-
162
-
163
-
164
-
165
-
166
-
167
-
168
-
169
-
170
-
171
-
172
-
173
-
174
-
175
-
176
-
177
-
178
-
179
-
180
-
181
-
182
-
183
-
184
-
185
-
186
-
187
-
188
-
189
-
190
-
191
-
192
-
193
-
194
-
195
-
196
-
197
-
198
-
199
-
200
-
201
-
202
-
203
-
204
-
205
-
206
-
207
-
208
-
209
-
210
-
211
-
212
-
213
-
214
-
215
-
216
-
217
-
218
-
219
-
220
-
221
-
222
-
223
-
224
-
225
-
226
-
227
 |
 |

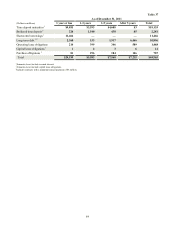
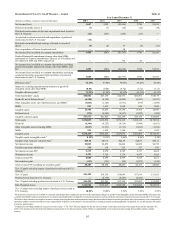
86
Total nonperforming assets to total loans plus
OREO, other repossessed assets, and
nonperforming LHFS
Common dividend payout ratio5
Capital Adequacy
Tier 1 common equity
Tier 1 capital
Total capital
Tier 1 leverage
1 Includes net securities gains
2.76
37.6
9.22%
10.90
13.67
8.75
$19
3.19
12.7
9.31%
11.10
13.91
8.90
$2
3.56
3.1
9.22%
11.11
14.01
8.92
$32
3.95
13.2
9.05%
11.00
13.92
8.72
$64
4.08
4.4
8.08%
13.67
16.54
10.94
$64
4.38
6.0
8.02%
13.58
16.42
11.03
$69
4.81
N/A
7.92%
13.51
16.96
10.94
$57
5.26
N/A
7.70%
13.13
16.68
10.95
$1
2 See Non-GAAP reconcilements in Table 42 of the MD&A.
3 For EPS calculation purposes, the impact of dilutive securities are excluded from the diluted share count during periods in which we recognize a net loss available to common
shareholders because the impact would be antidilutive.
4 Computed by dividing noninterest expense by total revenue-FTE. The FTE basis adjusts for the tax-favored status of net interest income from certain loans and investments. We
believe this measure to be the preferred industry measurement of net interest income and it enhances comparability of net interest income arising from taxable and tax-exempt sources.
5 The common dividend payout ratio is not calculable in a period of net loss.
6 “NM” - Calculated percentage was not considered to be meaningful.
FOURTH QUARTER 2011 RESULTS
We reported net income available to common shareholders of $71 million for the fourth quarter of 2011, a decrease of $43 million
compared with the same period of the prior year. Earnings per average common diluted share were $0.13 for the fourth quarter of
2011 compared with $0.23 for the fourth quarter of 2010. The fourth quarter of 2011 results were adversely impacted by the
potential mortgage servicing settlement and claims expense of $81 million, after tax, and a decline in fee income related to mortgage
and debit card fees, partially offset by higher net interest income, a lower provision for credit losses, and the reduction of preferred
dividends as a result of repurchasing the Series C and D preferred stock issued to the U.S. Treasury on March 30, 2011.
For the fourth quarter of 2011, net interest income on a FTE basis was $1.3 billion, an increase of $30 million, or 2%, compared
with the fourth quarter of 2010. Net interest income growth was driven by increased earning assets, lower rates on deposits, and
a continued shift in the deposit mix toward low-cost deposits, largely offset by lower earning asset yields. Net interest margin
increased 2 basis points to 3.46% in the fourth quarter of 2011 compared with 3.44% for the same period of 2010, primarily driven
by a 25 basis point decline in rates paid on interest-bearing liabilities, which more than offset a 20 basis point decline in earning
asset yields.
For the fourth quarter of 2011, the provision for credit losses was $327 million compared with $512 million in the fourth quarter
of 2010. The decline was due to lower net charge-offs and improved credit quality.
Total noninterest income was $723 million for the fourth quarter of 2011, a decrease of $309 million, or 30%, from the fourth
quarter of 2010. This decrease was primarily driven by an increase in the mortgage repurchase provision, the impact of HARP 2.0
on MSR valuations, and lower card fees with additional declines occurring across most other fee income categories. Compared
with the fourth quarter of 2010, mortgage-production related (loss)/income decreased by $103 million, predominantly due to a
$130 million increase in mortgage repurchase provision partially offset by higher income from loan production activities. Mortgage
servicing income decreased by $46 million compared with the fourth quarter of 2010 as a result of an increase in prepayment
assumptions attributable to anticipated refinancing activity arising from the HARP 2.0 program. This resulted in a $38 million
decline in the fair value of the MSRs. Card fee-based income decreased by $37 million during the fourth quarter of 2011 compared
with the fourth quarter of 2010, as as a result of regulations on debit card interchange fee income that became effective at the
beginning of this quarter. During the fourth quarter of 2011, we also recorded $19 million of net gains from the sale of securities
AFS compared to $64 million of net gains from the sale of securities AFS in the fourth quarter of 2010 that were realized in
conjunction with the repositioning of our investment portfolio. Trading income/(loss) decreased by $16 million, compared with
the fourth quarter of 2010. The decline was largely driven by lower valuation gains on illiquid securities. Other noninterest income
declined $31 million, which included a $13 million gain recognized in the fourth quarter of 2010 from the sale of the MMMF
business.
Total noninterest expense was $1.7 billion during the fourth quarter of 2011, an increase of $119 million, or 8%, from the fourth
quarter of 2010. The increase was predominantly due to the $120 million potential mortgage servicing settlement and claims
expense related to mortgage servicing claims. See Note 20, "Contingencies" and Note 25, "Subsequent Event," to the Consolidated
Financial Statements in this Form 10-K for additional discussion. Additionally, operating losses increased by $70 million, which
was predominantly due to specific legal accruals and operating losses associated with mortgage servicing. Partially offsetting these
increases, was a decrease of $114 million in employee compensation and benefits compared with the fourth quarter of 2010. This
decline was largely driven by a $88 million gain recorded in connection with the decision to curtail our defined benefit pension
plans, partially offset by a $28 million discretionary 401(k) contribution. Additionally, employee compensation and benefits