SunTrust 2011 Annual Report Download - page 50
Download and view the complete annual report
Please find page 50 of the 2011 SunTrust annual report below. You can navigate through the pages in the report by either clicking on the pages listed below, or by using the keyword search tool below to find specific information within the annual report.-
 1
1 -
2
-
3
-
4
-
5
-
6
-
7
-
8
-
9
-
10
-
11
-
12
-
13
-
14
-
15
-
16
-
17
-
18
-
19
-
20
-
21
-
22
-
23
-
24
-
25
-
26
-
27
-
28
-
29
-
30
-
31
-
32
-
33
-
34
-
35
-
36
-
37
-
38
-
39
-
 40
40 -
 41
41 -
 42
42 -
 43
43 -
 44
44 -
 45
45 -
 46
46 -
 47
47 -
 48
48 -
 49
49 -
 50
50 -
 51
51 -
 52
52 -
 53
53 -
 54
54 -
 55
55 -
 56
56 -
 57
57 -
 58
58 -
 59
59 -
 60
60 -
61
-
62
-
63
-
64
-
65
-
66
-
67
-
68
-
69
-
70
-
71
-
72
-
73
-
74
-
75
-
76
-
77
-
78
-
79
-
80
-
81
-
82
-
83
-
84
-
85
-
86
-
87
-
88
-
89
-
90
-
91
-
92
-
93
-
94
-
95
-
96
-
97
-
98
-
99
-
100
-
101
-
102
-
103
-
104
-
105
-
106
-
107
-
108
-
109
-
110
-
111
-
112
-
113
-
114
-
115
-
116
-
117
-
118
-
119
-
120
-
121
-
122
-
123
-
124
-
125
-
126
-
127
-
128
-
129
-
130
-
131
-
132
-
133
-
134
-
135
-
136
-
137
-
138
-
139
-
140
-
141
-
142
-
143
-
144
-
145
-
146
-
147
-
148
-
149
-
150
-
151
-
152
-
153
-
154
-
155
-
156
-
157
-
158
-
159
-
160
-
161
-
162
-
163
-
164
-
165
-
166
-
167
-
168
-
169
-
170
-
171
-
172
-
173
-
174
-
175
-
176
-
177
-
178
-
179
-
180
-
181
-
182
-
183
-
184
-
185
-
186
-
187
-
188
-
189
-
190
-
191
-
192
-
193
-
194
-
195
-
196
-
197
-
198
-
199
-
200
-
201
-
202
-
203
-
204
-
205
-
206
-
207
-
208
-
209
-
210
-
211
-
212
-
213
-
214
-
215
-
216
-
217
-
218
-
219
-
220
-
221
-
222
-
223
-
224
-
225
-
226
-
227
 |
 |
34
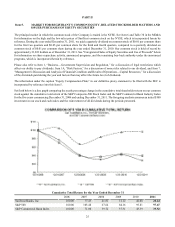
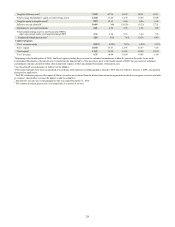
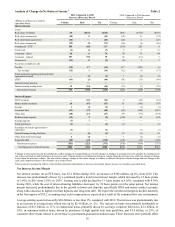
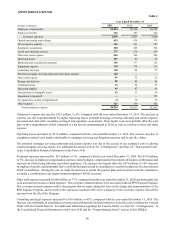
to both earlier years as a result of Regulation E changes in 2010. Noninterest expense increased 5% during 2011, driven
primarily by higher personnel costs, operating losses, regulatory costs, and potential mortgage servicing settlement and claims
expense, partially offset by lower gains on debt extinguishment. Compared to 2009, noninterest expense decreased by 5%
primarily due to the recognition of goodwill impairment in 2009, partially offset by higher personnel costs, operating losses,
and the potential mortgage servicing settlement and claims expense in 2011. The higher personnel costs are due to the hiring
of additional teammates, primarily in loss mitigation and in client service and support roles, and an increase in compensation
as a result of improved revenue generation in certain businesses. The increase in the operating losses was due to increases
in legal and mortgage servicing-related expenses, while the regulatory cost increases were due to the change in the FDIC
assessment calculation. The mortgage servicing settlement and claims expense includes an accrual of our estimated costs to
address certain mortgage servicing claims. See additional discussion of our financial performance in the “Consolidated
Financial Results” section of this MD&A, and Note 20, "Contingencies" and Note 25, "Subsequent Event," to the Consolidated
Financial Statements in this Form 10-K related to the potential mortgage servicing settlement and claims expense.
Line of Business Highlights
Many of our core businesses demonstrated positive trends during 2011, helping to offset some of the regulatory and
environmental challenges we encountered. Our strategic priorities to drive higher profitability from a more diverse platform
encompass growing consumer market and wallet share, diversifying the loan portfolio, optimizing our business mix, and
improving expense efficiency. The key to accomplishing these priorities is driven by our core performance within each line
of business.
• Despite the challenging regulatory environment, our Retail line of business accomplished growth in consumer market
and wallet share in 2011. While navigating numerous product changes, we were able to expand our primary
relationships and also expanded our product penetration per relationship. We grew our deposit market share in eight
of our ten largest markets, we grew average loan balances by 6%, and increased net income during 2011.
• Net income in our W&IM line of business increased 16% during 2011. The net income improvement was driven
by growth in revenue, led by retail investment income growth of 12%, while maintaining stable expenses. Improving
markets in 2012 could augment growth for this line of business.
• Growing the CIB and Diversified Commercial Banking lines of business are key elements to our strategy of optimizing
our business mix. In 2011, the CIB line of business experienced 26% average loan growth and record revenue and
net income, increasing by 8% and 11%, respectively. Our success in CIB is a result of growing revenue, expanding
relationships, and investing in talent. Solid growth in net interest income and fee income resulted in total revenue-
FTE and net income increasing 9% and 33%, respectively, in the Diversified Commercial Banking line of business
during 2011. Diversified Commercial Banking had a solid efficiency ratio, steady loan growth in the second half of
2011, and strong growth in core deposits and primary relationships driving the line of business' success in 2011.
Both of these businesses had attractive efficiency ratios and experienced low loss rates during 2011, and we will
look to build upon the positive expense efficiency and credit quality attributes in 2012.
While we are experiencing solid core business momentum in Retail, W&IM, CIB, and Diversified Commercial Banking,
legacy mortgage and CRE issues are weighing on our overall financial performance.
• The Mortgage line of business lost $693 million in 2011, largely due to issues related to loans originated in 2008
and prior. While we work through these legacy loan issues, during 2011 we experienced healthy mortgage origination
volumes, attractive margins, and significantly improved risk management.
• Our CRE line of business lost $310 million during 2011 as it had housing-related exposure as well, causing high
levels of loss recognition during the year. CRE is our smallest line of business, but one with a potential for earning
asset growth. In fact, we are transitioning the business back into production as we are beginning to see opportunities
in certain markets and asset classes.
Our Corporate Treasury and Other line of business encompasses all remaining areas of the Company and is key to our asset
and liability performance. This line of business has maintained an intense focus on balance sheet management and positioned
us for prolonged low interest rates due to a high level of discipline around our asset and liability pricing. This discipline has
benefited our margin in 2011, which helped drive the $447 million in net income in this line of business.