SunTrust 2011 Annual Report Download - page 101
Download and view the complete annual report
Please find page 101 of the 2011 SunTrust annual report below. You can navigate through the pages in the report by either clicking on the pages listed below, or by using the keyword search tool below to find specific information within the annual report.-
 1
1 -
2
-
3
-
4
-
5
-
6
-
7
-
8
-
9
-
10
-
11
-
12
-
13
-
14
-
15
-
16
-
17
-
18
-
19
-
20
-
21
-
22
-
23
-
24
-
25
-
26
-
27
-
28
-
29
-
30
-
31
-
32
-
33
-
34
-
35
-
36
-
37
-
38
-
39
-
40
-
41
-
42
-
43
-
44
-
45
-
46
-
47
-
48
-
49
-
50
-
51
-
52
-
53
-
54
-
55
-
56
-
57
-
58
-
59
-
60
-
61
-
62
-
63
-
64
-
65
-
66
-
67
-
68
-
69
-
70
-
71
-
72
-
73
-
74
-
75
-
76
-
77
-
78
-
79
-
80
-
81
-
82
-
83
-
84
-
85
-
86
-
87
-
88
-
89
-
90
-
 91
91 -
 92
92 -
 93
93 -
 94
94 -
 95
95 -
 96
96 -
 97
97 -
 98
98 -
 99
99 -
 100
100 -
 101
101 -
 102
102 -
 103
103 -
 104
104 -
 105
105 -
 106
106 -
 107
107 -
 108
108 -
 109
109 -
 110
110 -
 111
111 -
112
-
113
-
114
-
115
-
116
-
117
-
118
-
119
-
120
-
121
-
122
-
123
-
124
-
125
-
126
-
127
-
128
-
129
-
130
-
131
-
132
-
133
-
134
-
135
-
136
-
137
-
138
-
139
-
140
-
141
-
142
-
143
-
144
-
145
-
146
-
147
-
148
-
149
-
150
-
151
-
152
-
153
-
154
-
155
-
156
-
157
-
158
-
159
-
160
-
161
-
162
-
163
-
164
-
165
-
166
-
167
-
168
-
169
-
170
-
171
-
172
-
173
-
174
-
175
-
176
-
177
-
178
-
179
-
180
-
181
-
182
-
183
-
184
-
185
-
186
-
187
-
188
-
189
-
190
-
191
-
192
-
193
-
194
-
195
-
196
-
197
-
198
-
199
-
200
-
201
-
202
-
203
-
204
-
205
-
206
-
207
-
208
-
209
-
210
-
211
-
212
-
213
-
214
-
215
-
216
-
217
-
218
-
219
-
220
-
221
-
222
-
223
-
224
-
225
-
226
-
227
 |
 |

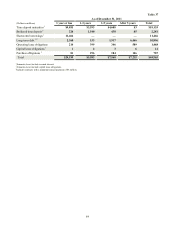
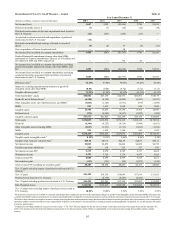
85
SELECTED QUARTERLY FINANCIAL DATA
(Dollars in millions, except per share data)
Summary of Operations
Interest income
Interest expense
Net interest income
Provision for credit losses
Net interest income after provision for credit
losses
Noninterest income1
Noninterest expense
Net income/(loss) before provision/(benefit) for
income taxes
(Benefit)/provision for income taxes
Net income/(loss) attributable to noncontrolling
interest
Net income/(loss)
Net income/(loss) available to common
shareholders
Net interest income - FTE2
Total revenue - FTE2
Total revenue - FTE excluding securities gains,
net2
Net income/(loss) per average common share:
Diluted3
Diluted excluding effect of accelerated
accretion associated with the repurchase of
preferred stock issued to the U.S. Treasury2, 3
Basic
Dividends paid per average common share
Book value per common share
Tangible book value per common share2
Market capitalization
Market price:
High
Low
Close
Selected Average Balances
Total assets
Earning assets
Loans
Consumer and commercial deposits
Brokered time and foreign deposits
Total shareholders’ equity
Average common shares - diluted (thousands)
Average common shares - basic (thousands)
Financial Ratios (Annualized)
ROA
ROE
Net interest margin - FTE
Efficiency ratio4
Tangible efficiency ratio2
Total average shareholders’ equity to total
average assets
Tangible equity to tangible assets2
Effective tax rate/(benefit)6
Allowance to period-end loans
Three Months Ended
2011
December 31
$1,543
249
1,294
327
967
723
1,667
23
(57)
6
$74
$71
$1,324
2,047
2,028
0.13
0.13
0.13
$0.05
36.86
25.18
9,504
21.31
15.79
17.70
$174,085
151,561
119,474
125,072
2,293
20,208
535,717
532,146
0.17%
1.41
3.46
81.45
80.99
11.61
8.10
NM
2.01
September 30
$1,538
275
1,263
347
916
903
1,560
259
45
(1)
$215
$211
$1,293
2,196
2,194
0.39
0.39
0.40
$0.05
37.29
25.60
9,639
26.52
16.51
17.95
$172,076
146,836
115,638
122,974
2,312
20,000
535,395
531,928
0.50%
4.23
3.49
71.05
70.55
11.62
8.38
17.33
2.22
June 30
$1,546
287
1,259
392
867
912
1,542
237
58
1
$178
$174
$1,286
2,198
2,166
0.33
0.33
0.33
$0.01
36.30
24.57
13,852
30.13
24.63
25.80
$170,527
145,985
114,920
121,879
2,340
19,509
535,416
531,792
0.42%
3.61
3.53
70.17
69.64
11.44
8.07
24.45
2.40
March 31
$1,554
305
1,249
447
802
883
1,465
220
33
7
$180
$38
$1,277
2,160
2,096
0.08
0.22
0.08
$0.01
35.49
23.79
15,482
33.14
27.38
28.84
$173,066
146,786
115,162
120,710
2,606
23,107
503,503
499,669
0.42%
0.84
3.53
67.83
67.32
13.35
7.87
15.54
2.49
2010
December 31
$1,595
329
1,266
512
754
1,032
1,548
238
45
8
$185
$114
$1,294
2,326
2,262
0.23
0.23
0.23
$0.01
36.34
23.76
14,768
29.82
23.25
29.51
$174,768
149,114
114,930
119,688
2,827
23,576
499,423
495,710
0.42%
2.44
3.44
66.57
66.07
13.49
10.12
19.66
2.58
September 30
$1,604
366
1,238
615
623
1,047
1,499
171
14
4
$153
$84
$1,266
2,313
2,244
0.17
0.17
0.17
$0.01
37.01
24.42
12,914
27.05
21.79
25.83
$171,999
147,249
113,322
117,233
2,740
23,091
498,802
495,501
0.35%
1.83
3.41
64.80
64.24
13.42
10.19
8.25
2.69
June 30
$1,570
392
1,178
662
516
952
1,503
(35)
(50)
3
$12
($56)
$1,208
2,160
2,103
(0.11)
(0.11)
(0.11)
$0.01
36.19
23.58
11,648
31.92
23.12
23.30
$171,273
145,464
113,016
116,460
2,670
22,313
498,999
495,351
0.03%
1.29
3.33
69.57
68.96
13.03
10.18
NM
2.81
Table 38
March 31
$1,574
402
1,172
862
310
698
1,361
(353)
(194)
2
($161)
($229)
$1,202
1,900
1,899
(0.46)
(0.46)
(0.46)
$0.01
35.40
22.76
13,391
28.39
20.16
26.79
$171,429
146,896
114,435
115,084
3,433
22,338
498,238
494,871
(0.38)%
(5.34)
3.32
71.60
70.91
13.03
9.86
NM
2.80