SunTrust 2011 Annual Report Download - page 59
Download and view the complete annual report
Please find page 59 of the 2011 SunTrust annual report below. You can navigate through the pages in the report by either clicking on the pages listed below, or by using the keyword search tool below to find specific information within the annual report.-
 1
1 -
2
-
3
-
4
-
5
-
6
-
7
-
8
-
9
-
10
-
11
-
12
-
13
-
14
-
15
-
16
-
17
-
18
-
19
-
20
-
21
-
22
-
23
-
24
-
25
-
26
-
27
-
28
-
29
-
30
-
31
-
32
-
33
-
34
-
35
-
36
-
37
-
38
-
39
-
40
-
41
-
42
-
43
-
44
-
45
-
46
-
47
-
48
-
 49
49 -
 50
50 -
 51
51 -
 52
52 -
 53
53 -
 54
54 -
 55
55 -
 56
56 -
 57
57 -
 58
58 -
 59
59 -
 60
60 -
 61
61 -
 62
62 -
 63
63 -
 64
64 -
 65
65 -
 66
66 -
 67
67 -
 68
68 -
 69
69 -
70
-
71
-
72
-
73
-
74
-
75
-
76
-
77
-
78
-
79
-
80
-
81
-
82
-
83
-
84
-
85
-
86
-
87
-
88
-
89
-
90
-
91
-
92
-
93
-
94
-
95
-
96
-
97
-
98
-
99
-
100
-
101
-
102
-
103
-
104
-
105
-
106
-
107
-
108
-
109
-
110
-
111
-
112
-
113
-
114
-
115
-
116
-
117
-
118
-
119
-
120
-
121
-
122
-
123
-
124
-
125
-
126
-
127
-
128
-
129
-
130
-
131
-
132
-
133
-
134
-
135
-
136
-
137
-
138
-
139
-
140
-
141
-
142
-
143
-
144
-
145
-
146
-
147
-
148
-
149
-
150
-
151
-
152
-
153
-
154
-
155
-
156
-
157
-
158
-
159
-
160
-
161
-
162
-
163
-
164
-
165
-
166
-
167
-
168
-
169
-
170
-
171
-
172
-
173
-
174
-
175
-
176
-
177
-
178
-
179
-
180
-
181
-
182
-
183
-
184
-
185
-
186
-
187
-
188
-
189
-
190
-
191
-
192
-
193
-
194
-
195
-
196
-
197
-
198
-
199
-
200
-
201
-
202
-
203
-
204
-
205
-
206
-
207
-
208
-
209
-
210
-
211
-
212
-
213
-
214
-
215
-
216
-
217
-
218
-
219
-
220
-
221
-
222
-
223
-
224
-
225
-
226
-
227
 |
 |

43
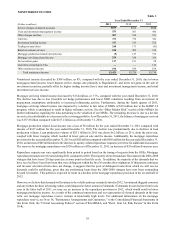
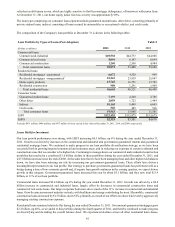
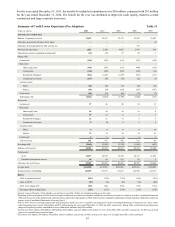
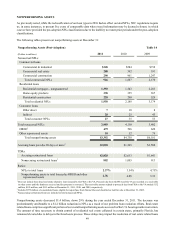
especially home equity and residential construction. The overall decline was predominantly driven by payoffs, with current
year net charge-offs and transfers to OREO also contributing to the decline.
Consumer loans increased $4.0 billion, up 25% during the year ended December 31, 2011. Growth occurred across all consumer
loan classes, with government-guaranteed student loans being the largest driver, increasing by $2.9 billion, up 69%, due to
portfolio acquisitions.
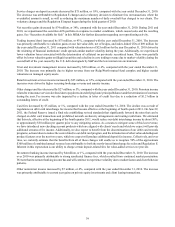
Loans Held for Sale
LHFS decreased $1.1 billion, down 33% during the year ended December 31, 2011. The decline was attributable to a reduction
in closed mortgage loan volume, coupled with increased delivery volume to our LHFI portfolio.
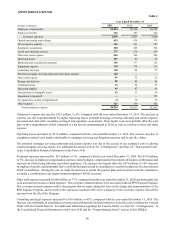
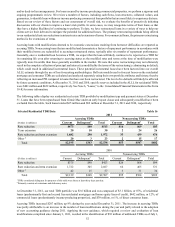
Loan Portfolio by Types of Loans (Pre-Adoption)
(Dollars in millions)
Commercial
Real estate:
Home equity lines
Construction
Residential mortgages1
Commercial real estate:
Owner occupied
Investor owned
Consumer:
Direct
Indirect
Credit card
LHFI
LHFS
2011
$40,104
14,287
2,143
32,608
7,753
4,758
9,655
10,164
1,023
$122,495
$2,353
2010
$34,064
15,040
3,848
31,572
8,674
5,868
6,638
9,291
980
$115,975
$3,501
2009
$32,494
15,953
6,647
30,790
8,915
6,159
5,118
6,531
1,068
$113,675
$4,670
2008
$41,040
16,454
9,864
32,066
8,758
6,199
5,139
6,508
970
$126,998
$4,032
Table 6
2007
$35,929
14,912
13,777
32,780
7,948
4,661
3,964
7,494
854
$122,319
$8,852
1For the years ended December 31, 2011, 2010, 2009, 2008, and 2007, includes $431 million, $488 million, $437 million, $239 million, and $221 million,
respectively, of loans carried at fair value.
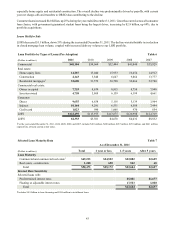
Selected Loan Maturity Data
(Dollars in millions)
Loan Maturity
Commercial and commercial real estate1
Real estate - construction
Total
Interest Rate Sensitivity
Selected loans with:
Predetermined interest rates
Floating or adjustable interest rates
Total
As of December 31, 2011
Total
$49,233
1,240
$50,473
1 year or less
$24,522
650
$25,172
1-5 years
$22,082
522
$22,604
$5,081
17,523
$22,604
Table 7
After 5 years
$2,629
68
$2,697
$1,677
1,020
$2,697
1Excludes $4.5 billion in lease financing and $936 million in installment loans.