SunTrust 2011 Annual Report Download - page 51
Download and view the complete annual report
Please find page 51 of the 2011 SunTrust annual report below. You can navigate through the pages in the report by either clicking on the pages listed below, or by using the keyword search tool below to find specific information within the annual report.-
 1
1 -
2
-
3
-
4
-
5
-
6
-
7
-
8
-
9
-
10
-
11
-
12
-
13
-
14
-
15
-
16
-
17
-
18
-
19
-
20
-
21
-
22
-
23
-
24
-
25
-
26
-
27
-
28
-
29
-
30
-
31
-
32
-
33
-
34
-
35
-
36
-
37
-
38
-
39
-
40
-
 41
41 -
 42
42 -
 43
43 -
 44
44 -
 45
45 -
 46
46 -
 47
47 -
 48
48 -
 49
49 -
 50
50 -
 51
51 -
 52
52 -
 53
53 -
 54
54 -
 55
55 -
 56
56 -
 57
57 -
 58
58 -
 59
59 -
 60
60 -
 61
61 -
62
-
63
-
64
-
65
-
66
-
67
-
68
-
69
-
70
-
71
-
72
-
73
-
74
-
75
-
76
-
77
-
78
-
79
-
80
-
81
-
82
-
83
-
84
-
85
-
86
-
87
-
88
-
89
-
90
-
91
-
92
-
93
-
94
-
95
-
96
-
97
-
98
-
99
-
100
-
101
-
102
-
103
-
104
-
105
-
106
-
107
-
108
-
109
-
110
-
111
-
112
-
113
-
114
-
115
-
116
-
117
-
118
-
119
-
120
-
121
-
122
-
123
-
124
-
125
-
126
-
127
-
128
-
129
-
130
-
131
-
132
-
133
-
134
-
135
-
136
-
137
-
138
-
139
-
140
-
141
-
142
-
143
-
144
-
145
-
146
-
147
-
148
-
149
-
150
-
151
-
152
-
153
-
154
-
155
-
156
-
157
-
158
-
159
-
160
-
161
-
162
-
163
-
164
-
165
-
166
-
167
-
168
-
169
-
170
-
171
-
172
-
173
-
174
-
175
-
176
-
177
-
178
-
179
-
180
-
181
-
182
-
183
-
184
-
185
-
186
-
187
-
188
-
189
-
190
-
191
-
192
-
193
-
194
-
195
-
196
-
197
-
198
-
199
-
200
-
201
-
202
-
203
-
204
-
205
-
206
-
207
-
208
-
209
-
210
-
211
-
212
-
213
-
214
-
215
-
216
-
217
-
218
-
219
-
220
-
221
-
222
-
223
-
224
-
225
-
226
-
227
 |
 |

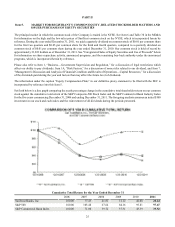
35
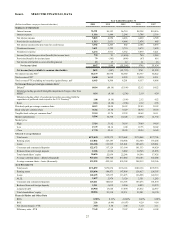
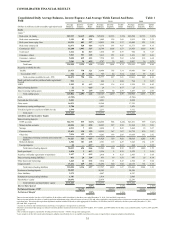
CONSOLIDATED FINANCIAL RESULTS
Consolidated Daily Average Balances, Income/Expense And Average Yields Earned And Rates
Paid
(Dollars in millions; yields on taxable-equivalent basis)
Assets
Loans:1,6
Real estate 1-4 family
Real estate construction
Real estate home equity lines
Real estate commercial
Commercial - FTE2
Credit card
Consumer - direct
Consumer - indirect
Nonaccrual3
Total loans
Securities available for sale:
Taxable
Tax-exempt - FTE2
Total securities available for sale - FTE
Funds sold and securities purchased under agreements
to resell
LHFS
Interest-bearing deposits
Interest earning trading assets
Total earning assets
ALLL
Cash and due from banks
Other assets
Noninterest earning trading assets
Unrealized gains on securities available for sale
Total assets
Liabilities and Shareholders’ Equity
Interest-bearing deposits:
NOW accounts
Money market accounts
Savings
Consumer time
Other time
Total interest-bearing consumer and commercial
deposits
Brokered deposits
Foreign deposits
Total interest-bearing deposits
Funds purchased
Securities sold under agreements to repurchase
Interest-bearing trading liabilities
Other short-term borrowings
Long-term debt
Total interest-bearing liabilities
Noninterest-bearing deposits
Other liabilities
Noninterest-bearing trading liabilities
Shareholders’ equity
Total liabilities and shareholders’ equity
Interest Rate Spread
Net Interest Income - FTE4
Net Interest Margin5
2011
Average
Balances
$29,227
2,119
14,299
12,871
36,248
1,012
7,261
9,690
3,581
116,308
23,973
502
24,475
992
2,255
22
3,750
147,802
(2,702)
5,203
16,831
2,708
2,598
$172,440
$24,751
42,854
4,535
12,451
7,036
91,627
2,306
80
94,013
1,038
2,157
851
3,465
13,496
115,020
31,045
3,972
1,707
20,696
$172,440
Income/
Expense
$1,419
83
482
520
1,945
82
321
439
34
5,325
770
28
798
—
93
—
79
6,295
$35
161
7
198
122
523
101
—
624
2
3
26
12
449
1,116
$5,179
Yields/
Rates
4.85%
3.94
3.37
4.04
5.37
8.13
4.42
4.53
0.95
4.58
3.21
5.48
3.26
—
4.13
0.15
2.10
4.26
0.14%
0.38
0.15
1.59
1.73
0.57
4.38
0.57
0.66
0.13
0.15
3.04
0.36
3.33
0.97
3.29%
3.50%
2010
Average
Balances
$29,058
3,402
14,912
14,578
32,788
1,058
5,812
7,530
4,787
113,925
24,994
783
25,777
969
3,295
26
3,195
147,187
(3,045)
4,821
18,268
2,913
2,231
$172,375
$24,668
38,893
4,028
14,232
9,205
91,026
2,561
355
93,942
1,226
2,416
833
3,014
16,096
117,527
26,103
4,097
1,814
22,834
$172,375
Income/
Expense
$1,553
126
503
593
1,828
89
251
423
39
5,405
785
42
827
1
136
—
90
6,459
$58
227
9
267
189
750
110
—
860
2
4
30
13
580
1,489
$4,970
Yields/
Rates
5.35%
3.69
3.37
4.07
5.57
8.39
4.32
5.62
0.81
4.74
3.14
5.34
3.21
0.08
4.14
0.17
2.79
4.39
0.24%
0.58
0.22
1.87
2.05
0.82
4.29
0.13
0.92
0.19
0.15
3.58
0.43
3.60
1.27
3.12%
3.38%
2009
Average
Balances
$29,588
5,991
15,685
15,573
36,458
984
5,101
6,594
5,067
121,041
18,960
1,003
19,963
794
5,228
25
3,857
150,908
(2,706)
4,844
17,355
3,429
1,612
$175,442
$23,601
31,864
3,664
16,718
13,068
88,915
5,648
434
94,997
1,670
2,483
487
2,704
20,119
122,460
24,249
4,387
2,060
22,286
$175,442
Table 1
Income/
Expense
$1,723
198
523
639
1,820
74
207
418
36
5,638
790
55
845
2
233
—
115
6,833
$99
315
10
479
382
1,285
154
1
1,440
3
5
20
15
761
2,244
$4,589
Yields/
Rates
5.82%
3.31
3.34
4.11
4.99
7.47
4.06
6.34
0.72
4.66
4.17
5.46
4.23
0.27
4.45
0.91
2.99
4.53
0.42%
0.99
0.27
2.87
2.92
1.45
2.69
0.12
1.52
0.19
0.18
4.14
0.54
3.78
1.83
2.70%
3.04%
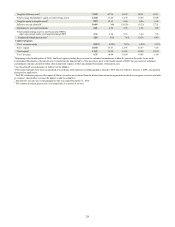
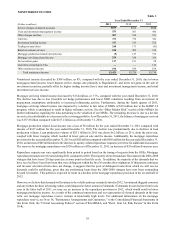
1Interest income includes loan fees of $138 million, $146 million, and $148 million for the three years ended December 31, 2011, 2010 and 2009, respectively.
2Interest income includes the effects of taxable-equivalent adjustments using a federal income tax rate of 35% and, where applicable, state income taxes to increase tax-exempt interest income to a taxable-
equivalent basis. The net taxable-equivalent adjustment amounts included in the above table aggregated $114 million, $116 million, and $123 million for the three years ended December 31, 2011,
2010 and 2009, respectively.
3 Income on consumer and residential nonaccrual loans, if recognized, is recognized on a cash basis.
4Derivative instruments that manage our interest-sensitivity position increased net interest income $639 million, $617 million, and $488 million for the three years ended December 31, 2011, 2010 and 2009,
respectively.
5The net interest margin is calculated by dividing net interest income – FTE by average total earning assets.
6Loan categories in this table are presented using pre-adoption classifications due to an inability to produce prior years average balances using post-adoption classifications.