SunTrust 2011 Annual Report Download - page 151
Download and view the complete annual report
Please find page 151 of the 2011 SunTrust annual report below. You can navigate through the pages in the report by either clicking on the pages listed below, or by using the keyword search tool below to find specific information within the annual report.-
 1
1 -
2
-
3
-
4
-
5
-
6
-
7
-
8
-
9
-
10
-
11
-
12
-
13
-
14
-
15
-
16
-
17
-
18
-
19
-
20
-
21
-
22
-
23
-
24
-
25
-
26
-
27
-
28
-
29
-
30
-
31
-
32
-
33
-
34
-
35
-
36
-
37
-
38
-
39
-
40
-
41
-
42
-
43
-
44
-
45
-
46
-
47
-
48
-
49
-
50
-
51
-
52
-
53
-
54
-
55
-
56
-
57
-
58
-
59
-
60
-
61
-
62
-
63
-
64
-
65
-
66
-
67
-
68
-
69
-
70
-
71
-
72
-
73
-
74
-
75
-
76
-
77
-
78
-
79
-
80
-
81
-
82
-
83
-
84
-
85
-
86
-
87
-
88
-
89
-
90
-
91
-
92
-
93
-
94
-
95
-
96
-
97
-
98
-
99
-
100
-
101
-
102
-
103
-
104
-
105
-
106
-
107
-
108
-
109
-
110
-
111
-
112
-
113
-
114
-
115
-
116
-
117
-
118
-
119
-
120
-
121
-
122
-
123
-
124
-
125
-
126
-
127
-
128
-
129
-
130
-
131
-
132
-
133
-
134
-
135
-
136
-
137
-
138
-
139
-
140
-
 141
141 -
 142
142 -
 143
143 -
 144
144 -
 145
145 -
 146
146 -
 147
147 -
 148
148 -
 149
149 -
 150
150 -
 151
151 -
 152
152 -
 153
153 -
 154
154 -
 155
155 -
 156
156 -
 157
157 -
 158
158 -
 159
159 -
 160
160 -
 161
161 -
162
-
163
-
164
-
165
-
166
-
167
-
168
-
169
-
170
-
171
-
172
-
173
-
174
-
175
-
176
-
177
-
178
-
179
-
180
-
181
-
182
-
183
-
184
-
185
-
186
-
187
-
188
-
189
-
190
-
191
-
192
-
193
-
194
-
195
-
196
-
197
-
198
-
199
-
200
-
201
-
202
-
203
-
204
-
205
-
206
-
207
-
208
-
209
-
210
-
211
-
212
-
213
-
214
-
215
-
216
-
217
-
218
-
219
-
220
-
221
-
222
-
223
-
224
-
225
-
226
-
227
 |
 |
Notes to Consolidated Financial Statements (Continued)
135
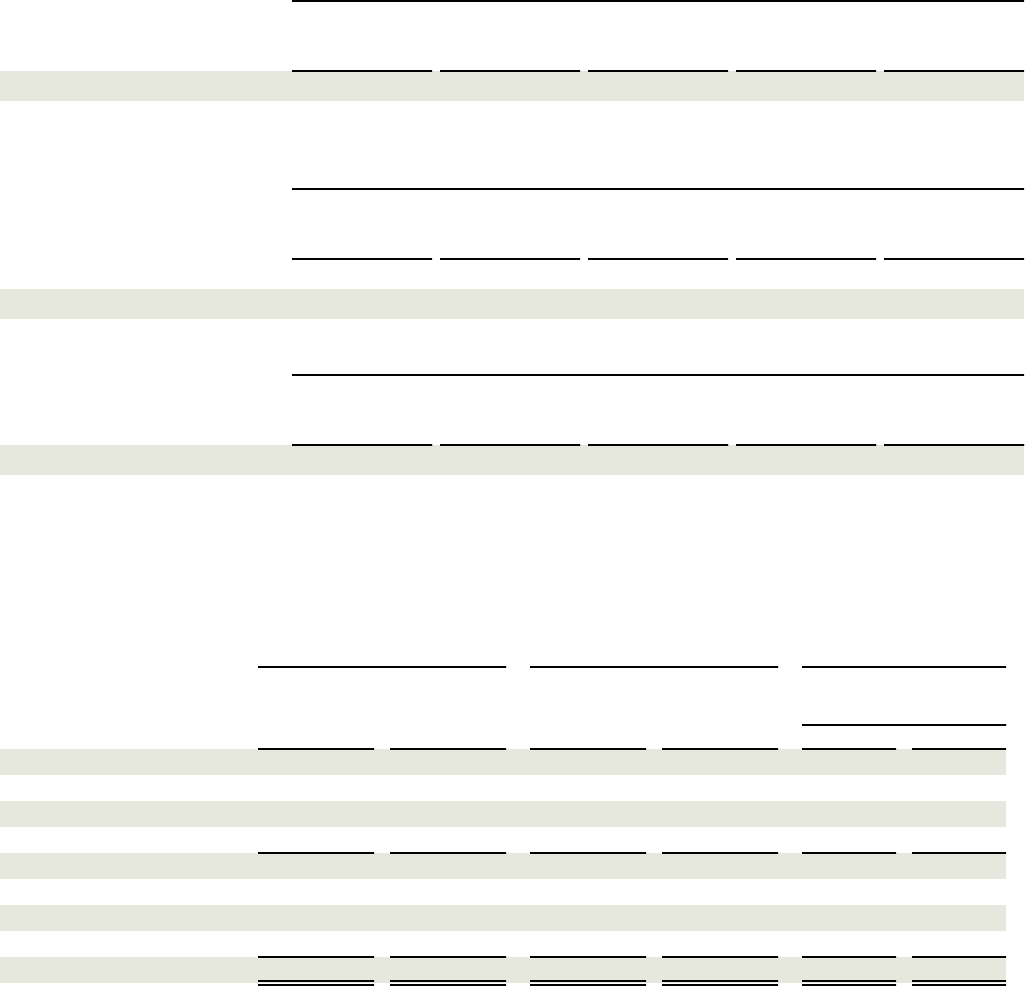
deferral of certain large exposures may have a more dramatic effect on the discount rate than the 20% discussed above.
Due to this, we estimate that if each of the retained positions experienced two additional large deferrals or default of an
underlying collateral obligation, the fair value of the retained ARS would decline approximately $14 million.
The total assets of the trust preferred CDO entities in which the Company has remaining exposure to loss was $1.2 billion
at December 31, 2011 and $1.3 billion at December 31, 2010. The Company determined that it was not the primary
beneficiary of any of these VIEs as the Company lacks the power to direct the significant activities of any of the VIEs.
No events occurred during the year ended December 31, 2011 that changed either the Company’s sale accounting or the
Company’s conclusions that it is not the primary beneficiary of these VIEs.
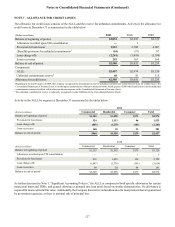
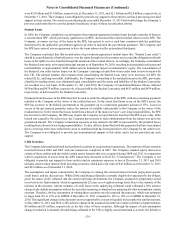
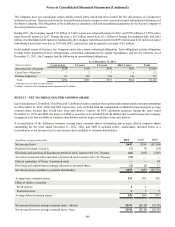
The following tables present certain information related to the Company’s asset transfers in which it has continuing economic
involvement for the years ended December 31, 2011, 2010, and 2009:
(Dollars in millions)
Cash flows on interests held
Servicing or management fees
(Dollars in millions)
Cash flows on interests held
Servicing or management fees
(Dollars in millions)
Cash flows on interests held
Servicing or management fees
Year Ended December 31, 2011
Residential
Mortgage
Loans
$48
3
Year Ended December 31, 2010
Residential
Mortgage
Loans
$66
4
Year Ended December 31, 2009
Residential
Mortgage
Loans
$94
5
Commercial
and Corporate
Loans
$1
10
Commercial
and Corporate
Loans
$4
12
Commercial
and Corporate
Loans
$2
11
Student
Loans
$—
—
Student
Loans
$8
1
Student
Loans
$7
1
CDO
Securities
$2
—
CDO
Securities
$2
—
CDO
Securities
$3
—
Total
$51
13
Total
$80
17
Total
$106
17
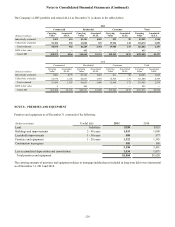
Portfolio balances and delinquency balances based on accruing loans 90 days or more past due and all nonaccrual loans as of
December 31 and net charge-offs related to managed portfolio loans (both those that are owned or consolidated by the Company
and those that have been transferred) for the years ended December 31, 2011 and 2010 are as follows:
(Dollars in millions)
Type of loan:
Commercial
Residential
Consumer
Total loan portfolio
Managed securitized loans:
Commercial
Residential
Total managed loans
Principal Balance
2011
$55,872
46,660
19,963
122,495
1,978
114,342
$238,815
2010
$53,488
46,521
15,966
115,975
2,244
120,429
$238,648
Past Due
2011
$938
3,079
914
4,931
43
3,310
$8,284
1
2010
$1,904
3,122
649
5,675
44
3,497
$9,216
1
Net Charge-offs
Year Ended December 31
2011
$663
1,257
120
2,040
—
50
$2,090
2010
$988
1,716
151
2,855
22
46
$2,923
1Excludes loans that have completed the foreclosure or short sale process (i.e., involuntary prepayments).