SunTrust 2011 Annual Report Download - page 104
Download and view the complete annual report
Please find page 104 of the 2011 SunTrust annual report below. You can navigate through the pages in the report by either clicking on the pages listed below, or by using the keyword search tool below to find specific information within the annual report.-
 1
1 -
2
-
3
-
4
-
5
-
6
-
7
-
8
-
9
-
10
-
11
-
12
-
13
-
14
-
15
-
16
-
17
-
18
-
19
-
20
-
21
-
22
-
23
-
24
-
25
-
26
-
27
-
28
-
29
-
30
-
31
-
32
-
33
-
34
-
35
-
36
-
37
-
38
-
39
-
40
-
41
-
42
-
43
-
44
-
45
-
46
-
47
-
48
-
49
-
50
-
51
-
52
-
53
-
54
-
55
-
56
-
57
-
58
-
59
-
60
-
61
-
62
-
63
-
64
-
65
-
66
-
67
-
68
-
69
-
70
-
71
-
72
-
73
-
74
-
75
-
76
-
77
-
78
-
79
-
80
-
81
-
82
-
83
-
84
-
85
-
86
-
87
-
88
-
89
-
90
-
91
-
92
-
93
-
 94
94 -
 95
95 -
 96
96 -
 97
97 -
 98
98 -
 99
99 -
 100
100 -
 101
101 -
 102
102 -
 103
103 -
 104
104 -
 105
105 -
 106
106 -
 107
107 -
 108
108 -
 109
109 -
 110
110 -
 111
111 -
 112
112 -
 113
113 -
 114
114 -
115
-
116
-
117
-
118
-
119
-
120
-
121
-
122
-
123
-
124
-
125
-
126
-
127
-
128
-
129
-
130
-
131
-
132
-
133
-
134
-
135
-
136
-
137
-
138
-
139
-
140
-
141
-
142
-
143
-
144
-
145
-
146
-
147
-
148
-
149
-
150
-
151
-
152
-
153
-
154
-
155
-
156
-
157
-
158
-
159
-
160
-
161
-
162
-
163
-
164
-
165
-
166
-
167
-
168
-
169
-
170
-
171
-
172
-
173
-
174
-
175
-
176
-
177
-
178
-
179
-
180
-
181
-
182
-
183
-
184
-
185
-
186
-
187
-
188
-
189
-
190
-
191
-
192
-
193
-
194
-
195
-
196
-
197
-
198
-
199
-
200
-
201
-
202
-
203
-
204
-
205
-
206
-
207
-
208
-
209
-
210
-
211
-
212
-
213
-
214
-
215
-
216
-
217
-
218
-
219
-
220
-
221
-
222
-
223
-
224
-
225
-
226
-
227
 |
 |
88
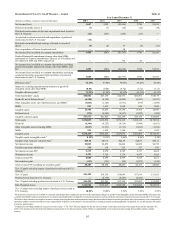
past twelve months. Partially offsetting those increases were decreases in home equity lines, residential mortgages, and business
banking loans. Loan related net interest income increased $60 million, or 7%, compared with the prior year driven by increased
loan volume, while net interest income related to LHFS declined $5 million, or 100%, and funding costs related to non-earning
assets decreased $26 million, or 11%.
Average deposit balances increased $1.6 billion, or 2%. Favorable deposit mix trends continued as low cost average deposit
balances increased, offsetting a $3.2 billion, or 15%, decline in average time deposits. Deposit-related net interest income decreased
$38 million, or 2%, as the value of deposits fell in the current interest rate environment.
Provision for credit losses was $784 million, a decrease of $208 million, or 21%, compared to the same period in 2010. The
decrease was driven by net charge-offs declines in home equity lines, commercial loans, residential mortgage loans, and credit
cards as well as slight declines in personal credit lines and other customer loans.
Total noninterest income was $1.1 billion, a decrease of $65 million, or 6%, compared with the same period in 2010. Service
charges on deposits decreased $65 million, or 11%, driven by lower NSF/overdraft fees resulting from Regulation E changes that
became effective in 2010. Card fee revenue decreased $4 million due to debit card interchange regulations that became effective
at the beginning of the fourth quarter of 2011. We expect an approximately 40% reduction in annual card fee revenue in 2012 due
to the recently effective regulations.
Total noninterest expense was $2.5 billion, down $5 million compared with the same period in 2010. The decrease was
predominantly driven by lower processing costs partially offset by increases in shared corporate expenses.
Diversified Commercial Banking
Diversified Commercial Banking reported net income of $269 million for the twelve months ended December 31, 2011, an increase
of $66 million, or 33%, compared to the same period in 2010. The increase in net income was attributable to a decrease in provision
for credit losses and increases in net interest income.
Net interest income was $725 million, a $68 million, or 10%, increase from the same period in 2010. Average loan balances
increased $0.5 billion, or 2%, with increases in commercial domestic loans, tax-exempt loans and auto dealer floor plan loans,
offset by decreases in leasing and commercial real estate loans. Loan-related net interest income increased $52 million, or 13%,
compared with the same period in 2010 due to increased loan spreads. Average customer deposit balances increased $1.0 billion,
or 5%, compared to the same period in 2010. Favorable trends in deposit mix continued as higher cost time deposits declined $0.4
billion, or 32%, while lower cost commercial demand deposits increased $1.9 billion, or 29%. NOW and money market combined
average balances decreased $0.5 billion, or 5%, as client preferences migrated to DDA products.
Provision for credit losses was $92 million, a decrease of $35 million, or 28%, from the prior year. The decrease was predominantly
driven by lower net charge-offs in lease financing, commercial domestic loans and commercial real estate loans.
Total noninterest income was $251 million, an increase of $16 million, or 7%, from the prior year predominantly driven by leasing
revenue. Additional increases in card services fees were offset by decreases in service charge fees on DDAs.
Total noninterest expense was $460 million, up $12 million, or 3%, from the prior year as lower other real estate expenses and
leasing equipment write downs were offset with higher operations expense, administrative overhead, and staff expense.
Commercial Real Estate
CRE reported a net loss of $310 million for the twelve months ended December 31, 2011, compared to a net loss of $329 million
for the same period in 2010. The decrease in net loss was predominantly due to lower provision for credit losses, lower noninterest
expense, and higher noninterest income, partially offset by lower net interest income.
Net interest income was $140 million, a $22 million, or 14%, decline from the same period in 2010. Average loan balances declined
$2.7 billion, or 27%, largely resulting from a $2.2 billion decrease in commercial real estate loans and approximately $0.5 billion
in non-accrual loans. Loan related net interest income decreased $26 million, or 18%, as the decrease in average balances more
than offset higher loan spreads. Average customer deposit balances were flat year-over-year as declines in higher cost deposits
were offset by increases in lower cost DDAs and savings accounts. Deposit related net interest income declined from prior year
by $3 million, or 8%, attributable to declining deposit spreads.
Provision for credit losses was $422 million, a $20 million, or 5%, decrease over the same period in 2010. Although gross charge-
offs related to residential land and investor owned real estate loans remained elevated for the year, the combination of lower charge-
offs and higher recoveries drove the favorable year-over-year change.