SunTrust 2011 Annual Report Download - page 74
Download and view the complete annual report
Please find page 74 of the 2011 SunTrust annual report below. You can navigate through the pages in the report by either clicking on the pages listed below, or by using the keyword search tool below to find specific information within the annual report.-
 1
1 -
2
-
3
-
4
-
5
-
6
-
7
-
8
-
9
-
10
-
11
-
12
-
13
-
14
-
15
-
16
-
17
-
18
-
19
-
20
-
21
-
22
-
23
-
24
-
25
-
26
-
27
-
28
-
29
-
30
-
31
-
32
-
33
-
34
-
35
-
36
-
37
-
38
-
39
-
40
-
41
-
42
-
43
-
44
-
45
-
46
-
47
-
48
-
49
-
50
-
51
-
52
-
53
-
54
-
55
-
56
-
57
-
58
-
59
-
60
-
61
-
62
-
63
-
 64
64 -
 65
65 -
 66
66 -
 67
67 -
 68
68 -
 69
69 -
 70
70 -
 71
71 -
 72
72 -
 73
73 -
 74
74 -
 75
75 -
 76
76 -
 77
77 -
 78
78 -
 79
79 -
 80
80 -
 81
81 -
 82
82 -
 83
83 -
 84
84 -
85
-
86
-
87
-
88
-
89
-
90
-
91
-
92
-
93
-
94
-
95
-
96
-
97
-
98
-
99
-
100
-
101
-
102
-
103
-
104
-
105
-
106
-
107
-
108
-
109
-
110
-
111
-
112
-
113
-
114
-
115
-
116
-
117
-
118
-
119
-
120
-
121
-
122
-
123
-
124
-
125
-
126
-
127
-
128
-
129
-
130
-
131
-
132
-
133
-
134
-
135
-
136
-
137
-
138
-
139
-
140
-
141
-
142
-
143
-
144
-
145
-
146
-
147
-
148
-
149
-
150
-
151
-
152
-
153
-
154
-
155
-
156
-
157
-
158
-
159
-
160
-
161
-
162
-
163
-
164
-
165
-
166
-
167
-
168
-
169
-
170
-
171
-
172
-
173
-
174
-
175
-
176
-
177
-
178
-
179
-
180
-
181
-
182
-
183
-
184
-
185
-
186
-
187
-
188
-
189
-
190
-
191
-
192
-
193
-
194
-
195
-
196
-
197
-
198
-
199
-
200
-
201
-
202
-
203
-
204
-
205
-
206
-
207
-
208
-
209
-
210
-
211
-
212
-
213
-
214
-
215
-
216
-
217
-
218
-
219
-
220
-
221
-
222
-
223
-
224
-
225
-
226
-
227
 |
 |
58
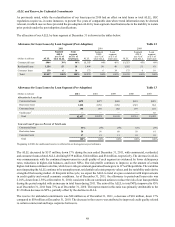
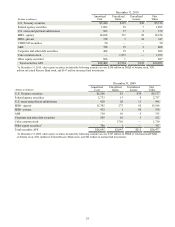
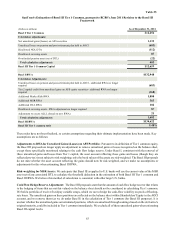
from selling, pledging, assigning, or otherwise using the pledged Coke common shares in its business.
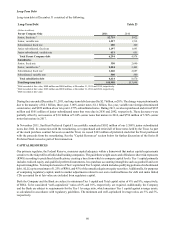
We generally may not prepay the Notes. The interest rate on the Notes will be reset upon or after the settlement of The
Agreements, either through a remarketing process, or based upon dealer quotations. In the event of an unsuccessful remarketing
of the Notes, we would be required to collateralize the Notes and the maturity of the Notes may accelerate to the first anniversary
of the settlement of The Agreements. However, we presently believe that it is substantially certain that the Notes will be
successfully remarketed.
The Agreements carry scheduled settlement terms of approximately seven years from the effective date. However, we have
the option to terminate The Agreements earlier with the approval of the Federal Reserve. The Agreements may also terminate
earlier upon certain events of default, extraordinary events regarding Coke, and other typical termination events. Upon such
early termination, there could be exit costs or gains, such as certain breakage fees including an interest rate make-whole
amount, associated with both The Agreements and the Notes. Such costs or gains may be material but cannot be determined
at the present time due to the unlikely occurrence of such events and the number of variables that are unknown. However, the
payment of such costs, if any, will not result in us receiving less than the Minimum Proceeds from The Agreements. We expect
to sell all of the Coke common shares upon settlement of The Agreements, either under the terms of The Agreements or in
another market transaction. See Note 17, “Derivative Financial Instruments,” to the Consolidated Financial Statements in this
Form 10-K for additional discussion of the transactions.
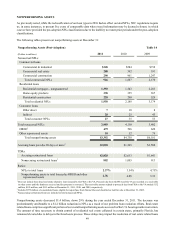
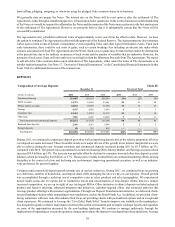
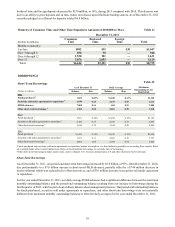
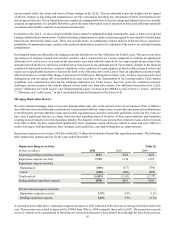
DEPOSITS
Composition of Average Deposits
(Dollars in millions)
Noninterest-bearing
NOW accounts
Money market accounts
Savings
Consumer time
Other time
Total consumer and commercial deposits
Brokered time deposits
Foreign deposits
Total deposits
December 31
2011
$31,045
24,751
42,854
4,535
12,451
7,036
122,672
2,306
80
$125,058
2010
$26,103
24,668
38,893
4,028
14,232
9,205
117,129
2,561
355
$120,045
2009
$24,249
23,601
31,864
3,664
16,718
13,068
113,164
5,648
434
$119,246
Percent of Total
2011
25%
20
34
4
10
5
98
2
—
100%
2010
22%
21
32
3
12
8
98
2
—
100%
Table 20
2009
20%
20
27
3
14
11
95
5
—
100%
During 2011, we continued to experience deposit growth as well as improving deposit mix as the relative proportion of lower
cost deposit accounts increased. These favorable trends were major drivers of the growth in net interest margin that we were
able to achieve during the year. Average consumer and commercial deposits increased during 2011 by $5.5 billion, up 5%,
compared with 2010. The growth was concentrated in noninterest bearing DDA, Money Market, and Savings accounts which
increased $9.4 billion, up 14%. The increase was partially offset by declines in consumer time and other time deposit account
balances which decreased by $4.0 billion, or 17%. These positive trends resulted from our continued marketing efforts, pricing
discipline in the context of a low and declining rate environment, improving operational execution, as well as an industry-
wide preference for greater liquidity.
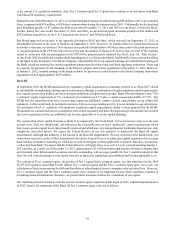
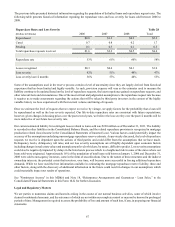
Consumer and commercial deposit growth remains one of our key initiatives. During 2011, we continued focus on growing
our client base, number of households, and deposit share while managing the rates we pay on our deposits. Overall growth
was accomplished through a judicious use of competitive rates in select products and select geographies. We experienced
mixed results across our 16 regions due to competitive forces and concentrations of time deposit clients; however, despite
increased competition, we are up in eight of our ten largest MSAs. Other initiatives to attract deposits included enhanced
product and features offerings, enhanced programs and initiatives, customer-targeted offers, and advanced analytics that
leverage product offerings with customer segmentation. Through our Deposit Transformation initiative, we delivered client-
focused banking solutions while responding to new regulations, such as the Dodd-Frank Act. In addition, we provided client-
facing teammates with new tools that enhance their focus on providing clients with personalized options and an exceptional
client experience. We continued to leverage the “Live Solid. Bank Solid.” brand to improve our visibility in the marketplace.
It is designed to speak to what is important to clients in the current environment and to inspire customer loyalty and capitalize
on some of the opportunities presented by the new banking landscape. We continue to manage judiciously through the
implications of impending or executed regulatory change and evaluate the impacts to our deposit products and clients. Average