SunTrust 2011 Annual Report Download - page 60
Download and view the complete annual report
Please find page 60 of the 2011 SunTrust annual report below. You can navigate through the pages in the report by either clicking on the pages listed below, or by using the keyword search tool below to find specific information within the annual report.-
 1
1 -
2
-
3
-
4
-
5
-
6
-
7
-
8
-
9
-
10
-
11
-
12
-
13
-
14
-
15
-
16
-
17
-
18
-
19
-
20
-
21
-
22
-
23
-
24
-
25
-
26
-
27
-
28
-
29
-
30
-
31
-
32
-
33
-
34
-
35
-
36
-
37
-
38
-
39
-
40
-
41
-
42
-
43
-
44
-
45
-
46
-
47
-
48
-
49
-
 50
50 -
 51
51 -
 52
52 -
 53
53 -
 54
54 -
 55
55 -
 56
56 -
 57
57 -
 58
58 -
 59
59 -
 60
60 -
 61
61 -
 62
62 -
 63
63 -
 64
64 -
 65
65 -
 66
66 -
 67
67 -
 68
68 -
 69
69 -
 70
70 -
71
-
72
-
73
-
74
-
75
-
76
-
77
-
78
-
79
-
80
-
81
-
82
-
83
-
84
-
85
-
86
-
87
-
88
-
89
-
90
-
91
-
92
-
93
-
94
-
95
-
96
-
97
-
98
-
99
-
100
-
101
-
102
-
103
-
104
-
105
-
106
-
107
-
108
-
109
-
110
-
111
-
112
-
113
-
114
-
115
-
116
-
117
-
118
-
119
-
120
-
121
-
122
-
123
-
124
-
125
-
126
-
127
-
128
-
129
-
130
-
131
-
132
-
133
-
134
-
135
-
136
-
137
-
138
-
139
-
140
-
141
-
142
-
143
-
144
-
145
-
146
-
147
-
148
-
149
-
150
-
151
-
152
-
153
-
154
-
155
-
156
-
157
-
158
-
159
-
160
-
161
-
162
-
163
-
164
-
165
-
166
-
167
-
168
-
169
-
170
-
171
-
172
-
173
-
174
-
175
-
176
-
177
-
178
-
179
-
180
-
181
-
182
-
183
-
184
-
185
-
186
-
187
-
188
-
189
-
190
-
191
-
192
-
193
-
194
-
195
-
196
-
197
-
198
-
199
-
200
-
201
-
202
-
203
-
204
-
205
-
206
-
207
-
208
-
209
-
210
-
211
-
212
-
213
-
214
-
215
-
216
-
217
-
218
-
219
-
220
-
221
-
222
-
223
-
224
-
225
-
226
-
227
 |
 |
44
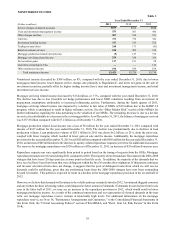
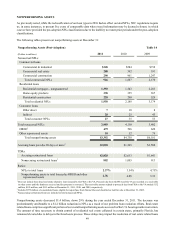
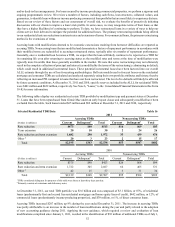
Asset Quality
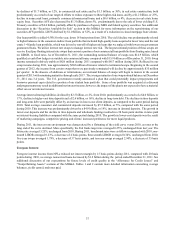
Our overall asset quality improved steadily throughout 2011, with net charge-offs, NPLs, and nonperforming assets all
declining, as compared with the prior year. The total delinquency ratio remained flat during 2011 compared with December
31, 2010, but increased 13 basis points during the fourth quarter of 2011. The increase was due to the purchase of government-
guaranteed student loan portfolios, which have higher delinquency rates, although the true loss exposure is very low due to
the government guarantee. Early stage delinquencies excluding government-guaranteed loans continued to trend lower, down
22 basis points during the year, driven by improvements in nonguaranteed mortgages and home equity loans. Commercial
and consumer early stage delinquencies reached relatively low levels of 0.17% and 0.68% of total loans at December 31,
2011, respectively, while residential early stage delinquencies declined to 1.38%. Any further improvement in overall
delinquencies will be influenced by the overall economy, particularly by changes in unemployment and to a lesser extent,
home values.
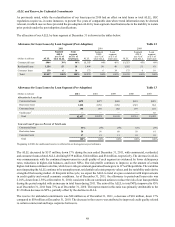
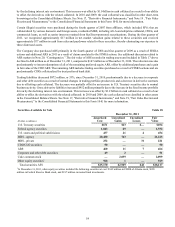
NPLs totaled $2.9 billion as of December 31, 2011, and compared to December 31, 2010, NPLs decreased $1.2 billion, down
29%. Approximately $1.0 billion of the overall decline came from commercial construction NPLs as a result of continuing
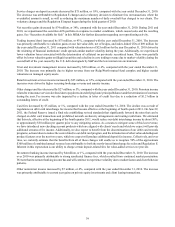
risk mitigation activities. We continue to be proactive in our credit monitoring and management processes to provide early
warning of problem loans. For example, we use an expanded liquidity and contingency analysis to provide a thorough view
of borrowers' capacity and their ability to service their debt obligations. We also have strict limits and exposure caps on specific
projects and borrowers for risk diversification. Due to the lack of new construction projects and the completion of many that
were previously started, the aggregate amount of interest reserves that we are obligated to fund has declined from prior periods
and are not considered significant relative to total loans outstanding.
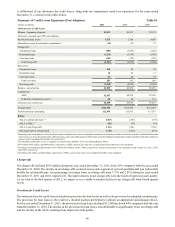
Overall asset quality trends for residential loans showed improvement throughout 2011. For the year, net charge-offs decreased
by over $800 million, or about 30%, with residential loans being the largest driver, contributing $459 million towards the
decline. Residential NPLs also declined modestly, down 11%, driven by improvements in residential construction and
nonguaranteed mortgages. As we look to the first quarter of 2012, we expect to see a further decline in NPLs, with net charge-
offs relatively stable to modestly down.
Net charge-offs and early stage delinquencies for the home equity portfolio declined, while NPLs remained relatively stable,
showing slight decreases during the year. Runoff in this portfolio has been concentrated in the higher LTV loans, where a
very limited amount of production has occurred during 2011. While these higher LTV loans have additional availability on
their home equity lines at December 31, 2011, 99% of already outstanding borrowings on the lines are accruing and current
on interest and principal.
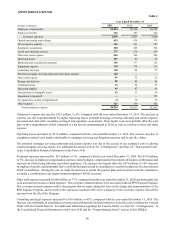
Commercial net charge-offs declined $325 million during 2011, down 33% compared to the prior year, led by decreases in
our commercial construction and commercial and industrial portfolios. Given the stresses in the commercial real estate market,
we have performed a thorough analysis of our commercial real estate portfolio to identify loans with an increased risk of
default. We believe that our investor-owned portfolio is appropriately diversified by borrower, geography, and property type.
We typically underwrite commercial projects to credit standards that are more stringent than historical commercial MBS
guidelines. Where appropriate, we have taken prudent actions with our client to strengthen our credit position. These actions
reflect market terms and structures and are intended to improve the client’s financial ability to perform. Impaired loans are
assessed relative to the client’s and guarantor’s, if any, ability to service the debt, the loan terms, and the value of the property.
These factors are taken into consideration when formulating our ALLL through our credit risk rating and/or specific reserving
processes. For the consumer portfolios, asset quality modestly improved, including early stage delinquencies, excluding
guaranteed student loans, that declined during the year. Additionally, the level of nonperforming consumer loans and net
charge-offs declined compared to the year ended December 31, 2010.
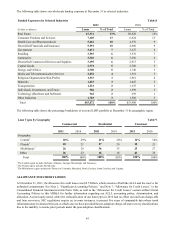
We believe that our loan portfolio is well diversified by product, client, and geography throughout our footprint. However,
our loan portfolio may be exposed to certain concentrations of credit risk which exist in relation to individual borrowers or
groups of borrowers, certain types of collateral, certain types of industries, certain loan products, or certain regions of the
country. See Note 6, “Loans,” to the Consolidated Financial Statements in this Form 10-K for more information.