SunTrust 2011 Annual Report Download - page 63
Download and view the complete annual report
Please find page 63 of the 2011 SunTrust annual report below. You can navigate through the pages in the report by either clicking on the pages listed below, or by using the keyword search tool below to find specific information within the annual report.-
 1
1 -
2
-
3
-
4
-
5
-
6
-
7
-
8
-
9
-
10
-
11
-
12
-
13
-
14
-
15
-
16
-
17
-
18
-
19
-
20
-
21
-
22
-
23
-
24
-
25
-
26
-
27
-
28
-
29
-
30
-
31
-
32
-
33
-
34
-
35
-
36
-
37
-
38
-
39
-
40
-
41
-
42
-
43
-
44
-
45
-
46
-
47
-
48
-
49
-
50
-
51
-
52
-
 53
53 -
 54
54 -
 55
55 -
 56
56 -
 57
57 -
 58
58 -
 59
59 -
 60
60 -
 61
61 -
 62
62 -
 63
63 -
 64
64 -
 65
65 -
 66
66 -
 67
67 -
 68
68 -
 69
69 -
 70
70 -
 71
71 -
 72
72 -
 73
73 -
74
-
75
-
76
-
77
-
78
-
79
-
80
-
81
-
82
-
83
-
84
-
85
-
86
-
87
-
88
-
89
-
90
-
91
-
92
-
93
-
94
-
95
-
96
-
97
-
98
-
99
-
100
-
101
-
102
-
103
-
104
-
105
-
106
-
107
-
108
-
109
-
110
-
111
-
112
-
113
-
114
-
115
-
116
-
117
-
118
-
119
-
120
-
121
-
122
-
123
-
124
-
125
-
126
-
127
-
128
-
129
-
130
-
131
-
132
-
133
-
134
-
135
-
136
-
137
-
138
-
139
-
140
-
141
-
142
-
143
-
144
-
145
-
146
-
147
-
148
-
149
-
150
-
151
-
152
-
153
-
154
-
155
-
156
-
157
-
158
-
159
-
160
-
161
-
162
-
163
-
164
-
165
-
166
-
167
-
168
-
169
-
170
-
171
-
172
-
173
-
174
-
175
-
176
-
177
-
178
-
179
-
180
-
181
-
182
-
183
-
184
-
185
-
186
-
187
-
188
-
189
-
190
-
191
-
192
-
193
-
194
-
195
-
196
-
197
-
198
-
199
-
200
-
201
-
202
-
203
-
204
-
205
-
206
-
207
-
208
-
209
-
210
-
211
-
212
-
213
-
214
-
215
-
216
-
217
-
218
-
219
-
220
-
221
-
222
-
223
-
224
-
225
-
226
-
227
 |
 |

47
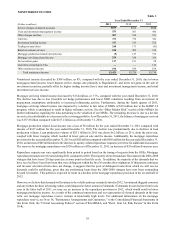
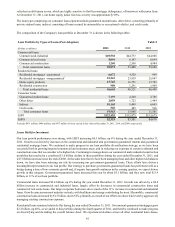
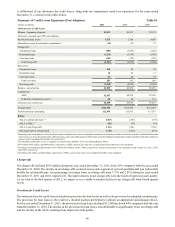
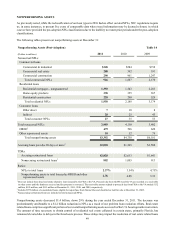
For the year ended December 31, 2011, the benefit for unfunded commitments was $10 million, compared with $57 million
for the year ended December 31, 2010. The benefit for the year was attributed to improved credit quality related to certain
commercial and large corporate borrowers.
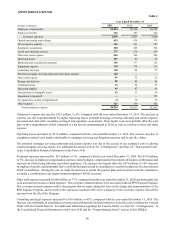
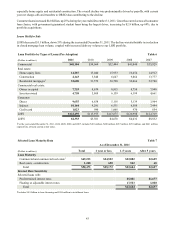
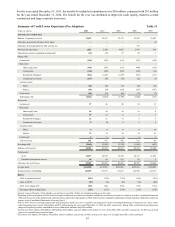
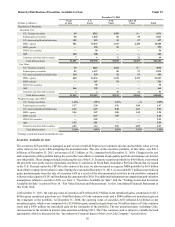
Summary of Credit Losses Experience (Pre-Adoption)
(Dollars in millions)
Allowance for Credit Losses
Balance - beginning of period
Allowance associated with loans at fair value1
Allowance from acquisitions & other activity, net
Provision for loan losses
(Benefit)/provision for unfunded commitments2
Charge-offs:
Commercial
Real estate:
Home equity lines
Construction
Residential mortgages3
Commercial real estate
Consumer loans:
Direct
Indirect
Credit cards
Total charge-offs
Recoveries:
Commercial
Real estate:
Home equity lines
Construction
Residential mortgages
Commercial real estate
Consumer loans:
Direct
Indirect
Credit cards
Total recoveries
Net charge-offs
Balance-end of period
Components:
ALLL
Unfunded commitments reserve
Allowance for credit losses
Average loans
Period-end loans outstanding
Ratios:
ALLL to period-end loans4
ALLL to NPLs5
ALLL to net charge-offs
Net charge-offs to average loans
2011
$3,032
—
—
1,523
(10)
(268)
(496)
(334)
(822)
(137)
(48)
(80)
(56)
(2,241)
57
40
29
22
8
8
32
5
201
(2,040)
$2,505
$2,457
48
$2,505
$116,308
122,495
2.01%
85%
1.20x
1.75%
2010
$3,235
—
1
2,708
(57)
(386)
(591)
(447)
(1,281)
(92)
(50)
(84)
(87)
(3,018)
46
40
12
21
(2)
8
33
5
163
(2,855)
$3,032
$2,974
58
$3,032
$113,925
115,975
2.58%
73%
1.04x
2.51%
2009
$2,379
—
—
4,007
87
(613)
(715)
(507)
(1,236)
(32)
(57)
(152)
(86)
(3,398)
40
30
8
18
4
8
49
3
160
(3,238)
$3,235
$3,120
115
$3,235
$121,041
113,675
2.76%
59%
0.96x
2.67%
2008
$1,290
—
159
2,474
20
(219)
(449)
(194)
(525)
(25)
(42)
(193)
(33)
(1,680)
24
16
3
8
1
8
54
2
116
(1,564)
$2,379
$2,351
28
$2,379
$125,433
126,998
1.86%
62%
1.50x
1.25%
Table 11
2007
$1,047
(4)
—
665
5
(134)
(116)
(12)
(113)
(2)
(24)
(107)
(7)
(515)
23
8
1
6
2
10
41
1
92
(423)
$1,290
$1,282
8
$1,290
$120,081
122,319
1.05%
102%
3.03x
0.35%
1 Amount removed from the ALLL related to our election to record $4.1 billion of residential mortgages at fair value.
2 Beginning in the fourth quarter of 2009, SunTrust began recording the provision for unfunded commitments within the provision for credit losses in the Consolidated Statements
of Income/(Loss). Given the immateriality of this provision, prior to the fourth quarter of 2009, the provision for unfunded commitments remains classified within other noninterest
expense in the Consolidated Statements of Income/(Loss).
3 Prior to 2009, borrower misrepresentation and denied insurance claim losses were recorded as operating losses in the Consolidated Statements of Income/(Loss). These credit-
related operating losses totaled $160 million and $78 million during the years ended December 31, 2008 and 2007, respectively. During 2009, credit-related operating losses
charged-off against previously established reserves within other liabilities total $195 million.
4 For this ratio, $433 million, $492 million, $449 million, $270 million, and $221 million at December 31, 2011, 2010, 2009, 2008, and 2007, respectively, of LHFI carried at fair
value were excluded from period-end loans.
5 $25 million, $28 million, $46 million, $46 million, and $172 million, respectively, of NPLs carried at fair value were excluded from NPLs in the calculation.