SunTrust 2011 Annual Report Download - page 199
Download and view the complete annual report
Please find page 199 of the 2011 SunTrust annual report below. You can navigate through the pages in the report by either clicking on the pages listed below, or by using the keyword search tool below to find specific information within the annual report.-
 1
1 -
2
-
3
-
4
-
5
-
6
-
7
-
8
-
9
-
10
-
11
-
12
-
13
-
14
-
15
-
16
-
17
-
18
-
19
-
20
-
21
-
22
-
23
-
24
-
25
-
26
-
27
-
28
-
29
-
30
-
31
-
32
-
33
-
34
-
35
-
36
-
37
-
38
-
39
-
40
-
41
-
42
-
43
-
44
-
45
-
46
-
47
-
48
-
49
-
50
-
51
-
52
-
53
-
54
-
55
-
56
-
57
-
58
-
59
-
60
-
61
-
62
-
63
-
64
-
65
-
66
-
67
-
68
-
69
-
70
-
71
-
72
-
73
-
74
-
75
-
76
-
77
-
78
-
79
-
80
-
81
-
82
-
83
-
84
-
85
-
86
-
87
-
88
-
89
-
90
-
91
-
92
-
93
-
94
-
95
-
96
-
97
-
98
-
99
-
100
-
101
-
102
-
103
-
104
-
105
-
106
-
107
-
108
-
109
-
110
-
111
-
112
-
113
-
114
-
115
-
116
-
117
-
118
-
119
-
120
-
121
-
122
-
123
-
124
-
125
-
126
-
127
-
128
-
129
-
130
-
131
-
132
-
133
-
134
-
135
-
136
-
137
-
138
-
139
-
140
-
141
-
142
-
143
-
144
-
145
-
146
-
147
-
148
-
149
-
150
-
151
-
152
-
153
-
154
-
155
-
156
-
157
-
158
-
159
-
160
-
161
-
162
-
163
-
164
-
165
-
166
-
167
-
168
-
169
-
170
-
171
-
172
-
173
-
174
-
175
-
176
-
177
-
178
-
179
-
180
-
181
-
182
-
183
-
184
-
185
-
186
-
187
-
188
-
 189
189 -
 190
190 -
 191
191 -
 192
192 -
 193
193 -
 194
194 -
 195
195 -
 196
196 -
 197
197 -
 198
198 -
 199
199 -
 200
200 -
 201
201 -
 202
202 -
 203
203 -
 204
204 -
 205
205 -
 206
206 -
 207
207 -
 208
208 -
 209
209 -
210
-
211
-
212
-
213
-
214
-
215
-
216
-
217
-
218
-
219
-
220
-
221
-
222
-
223
-
224
-
225
-
226
-
227
 |
 |
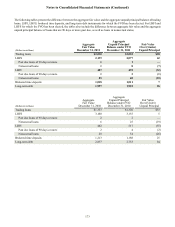
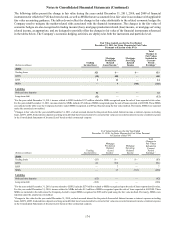
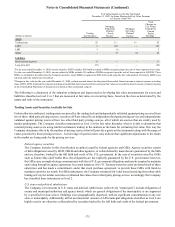
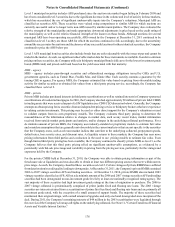
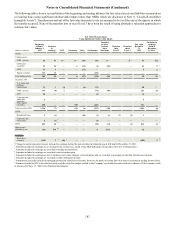
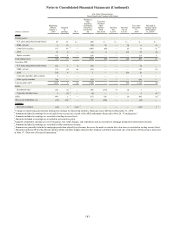
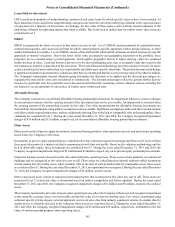
Notes to Consolidated Financial Statements (Continued)
183
(Dollars in millions)
Assets
Trading assets:
U.S. states and political subdivisions
MBS - private
CDO/CLO securities
ABS
Equity securities
Total trading assets
Securities AFS:
U.S. states and political subdivisions
MBS - private
ABS
Corporate and other debt securities
Other equity securities
Total securities AFS
LHFS:
Residential loans
Corporate and other loans
LHFI
Other assets/(liabilities), net
Liabilities
Derivative contracts
Fair Value Measurements
Using Significant Unobservable Inputs
Beginning
balance
January 1,
2010
$7
6
175
51
151
390
132
378
102
5
705
1,322
142
9
449
(35)
(46)
Included
in
earnings
$1
10
49
9
8
77
3
(2)
4
—
—
5
(4)
(2)
3
392
2
2
3
4
5
6
7
5
3
OCI
$—
—
—
—
—
—
2
64
—
—
—
66
—
—
—
—
(101)
8
Purchases,
sales,
issuances,
settlements,
maturities,
paydowns,
net
($8)
(36)
(109)
(3)
(36)
(192)
(63)
(93)
7
—
(15)
(164)
(89)
(2)
(57)
17
—
Transfers
from/(to)
other
balance
sheet
line items
$—
35
(60)
2
—
(23)
—
—
—
—
—
—
(118)
—
100
(398)
—
Transfers
into
Level 3
$—
—
—
—
—
—
—
—
—
—
—
—
75
—
—
—
—
Transfers
out of
Level 3
$—
(9)
(2)
(32)
—
(43)
—
—
(93)
—
—
(93)
(4)
—
(3)
—
—
Fair value
December
31,
2010
$—
6
53
27
123
209
74
347
20
5
690
1,136
2
5
492
(24)
(145)
Included in
earnings (held
at December
31, 2010) 1
$—
(1)
13
(2)
3
13
—
(2)
—
—
—
(2)
—
(2)
(5)
—
2
2
3
4
6
7
3
1 Change in unrealized gains/(losses) included in earnings for the period related to financial assets still held at December 31, 2010.
2 Amounts included in earnings do not include losses accrued as a result of the ARS settlements discussed in Note 20, "Contingencies."
3 Amounts included in earnings are recorded in trading income/(loss).
4 Amounts included in earnings are recorded in net securities gains.
5Amounts included in earnings are net of issuances, fair value changes, and expirations and are recorded in mortgage production related (loss)/income.
6 Amounts included in earnings are recorded in other noninterest income.
7 Amounts are generally included in mortgage production related (loss)/income, however, the mark on certain fair value loans is included in trading income/(loss).
8 Amount recorded in OCI is the effective portion of the cash flow hedges related to the Company’s probable forecasted sale of its shares of Coke stock as discussed
in Note 17, “Derivative Financial Instruments.”