SunTrust 2011 Annual Report Download - page 105
Download and view the complete annual report
Please find page 105 of the 2011 SunTrust annual report below. You can navigate through the pages in the report by either clicking on the pages listed below, or by using the keyword search tool below to find specific information within the annual report.-
 1
1 -
2
-
3
-
4
-
5
-
6
-
7
-
8
-
9
-
10
-
11
-
12
-
13
-
14
-
15
-
16
-
17
-
18
-
19
-
20
-
21
-
22
-
23
-
24
-
25
-
26
-
27
-
28
-
29
-
30
-
31
-
32
-
33
-
34
-
35
-
36
-
37
-
38
-
39
-
40
-
41
-
42
-
43
-
44
-
45
-
46
-
47
-
48
-
49
-
50
-
51
-
52
-
53
-
54
-
55
-
56
-
57
-
58
-
59
-
60
-
61
-
62
-
63
-
64
-
65
-
66
-
67
-
68
-
69
-
70
-
71
-
72
-
73
-
74
-
75
-
76
-
77
-
78
-
79
-
80
-
81
-
82
-
83
-
84
-
85
-
86
-
87
-
88
-
89
-
90
-
91
-
92
-
93
-
94
-
 95
95 -
 96
96 -
 97
97 -
 98
98 -
 99
99 -
 100
100 -
 101
101 -
 102
102 -
 103
103 -
 104
104 -
 105
105 -
 106
106 -
 107
107 -
 108
108 -
 109
109 -
 110
110 -
 111
111 -
 112
112 -
 113
113 -
 114
114 -
 115
115 -
116
-
117
-
118
-
119
-
120
-
121
-
122
-
123
-
124
-
125
-
126
-
127
-
128
-
129
-
130
-
131
-
132
-
133
-
134
-
135
-
136
-
137
-
138
-
139
-
140
-
141
-
142
-
143
-
144
-
145
-
146
-
147
-
148
-
149
-
150
-
151
-
152
-
153
-
154
-
155
-
156
-
157
-
158
-
159
-
160
-
161
-
162
-
163
-
164
-
165
-
166
-
167
-
168
-
169
-
170
-
171
-
172
-
173
-
174
-
175
-
176
-
177
-
178
-
179
-
180
-
181
-
182
-
183
-
184
-
185
-
186
-
187
-
188
-
189
-
190
-
191
-
192
-
193
-
194
-
195
-
196
-
197
-
198
-
199
-
200
-
201
-
202
-
203
-
204
-
205
-
206
-
207
-
208
-
209
-
210
-
211
-
212
-
213
-
214
-
215
-
216
-
217
-
218
-
219
-
220
-
221
-
222
-
223
-
224
-
225
-
226
-
227
 |
 |
89
Total noninterest income was $100 million, an increase of $12 million, or 14%, from the same period in 2010. The increase was
the result of a gain from the sale of a SunTrust Community Capital property, gains from the sale of state tax credits, and higher
income related to Affordable Housing.
Total noninterest expense was $448 million, a decrease of $21 million, or 4%, over the same period in 2010. The decrease was
driven by lower credit-related expenses, staff expense, and Affordable Housing-related expense. Partially offsetting these decreases
were higher allocated administrative expenses.
Corporate and Investment Banking
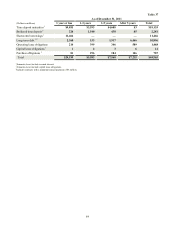
CIB's net income for the twelve months ended December 31, 2011 was $355 million, an increase of $35 million, or 11%, compared
to the same period in 2010. The increase was driven by higher net interest income and a decline in provision for credit losses,
which were partially offset by an increase in noninterest expense.
Net interest income was $501 million, an increase of $119 million, or 31%, from the prior year. The increase was primarily driven
by a $2.8 billion, or 26%, increase in average loan balances. The increase in loan balances was largely the result of a $0.7 billion
increase in Three Pillars, our CP conduit, a $0.3 billion increase in asset-based lending loans, additional increases in term loans,
and an increase of line of credit utilization. The increase in average loan balances, as well as higher loan spreads, resulted in a $90
million, or 37%, increase in loan-related income. Total average customer deposits increased $1.8 billion, or 27%, with growth
concentrated in DDAs, NOW accounts, and money market accounts. Higher deposit volumes resulted in increased net interest
income of $28 million.
Provision for loan losses for 2011 was a net recovery of $10 million, compared to net charge-offs of $50 million from the prior
year. Lower net charge-offs related to large corporate borrowers operating in economically sensitive industries drove the decline.
Total noninterest income was $636 million, a decrease of $36 million, or 5%, compared to the prior year. The decrease is
predominantly due to performance in Three Pillars, equity and fixed income derivatives, and taxable fixed income sales and trading;
but is partially offset by improved performance in loan syndications and structured lending, lower derivative counterparty reserves,
and a decline in valuation related losses associated with the deterioration of collateral on previously securitized loans.
Total noninterest expense was $587 million, an increase of $89 million, or 18%. The increase was predominantly due to higher
operating losses tied to increased legal-related expenses. Additionally, higher staff expense associated with additional investments
in personnel, as well as compensation accruals tied to our Merchant Banking business along with increased operating costs tied
to growth in loans and deposits, contributed to higher overall expense.
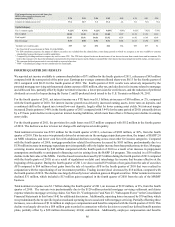
Mortgage
Mortgage reported a net loss of $693 million for the year ended December 31, 2011, an improvement of $94 million, or 12%,
compared to the same period in 2010. The improvement was driven by lower provision for credit losses that was partially offset
by lower production income, lower MSR net hedge performance, and higher expenses.
Net interest income was $492 million, up $34 million, or 7%, over the prior year. The increase was predominantly due to higher
net interest income on loans, which increased $55 million, due to improved spreads. Total average loans, primarily residential
mortgages were relatively consistent with prior year, increasing $85 million. The improvement in net interest income on loans
was partially offset by lower income on LHFS, which declined $31 million due to lower volumes and spreads.
Provision for credit losses was $693 million, a decrease of $490 million, or 41%, from the same period in 2010. The decline was
driven by a $403 million decline in residential mortgage net charge-offs. Net charge-offs included $10 million and $51 million of
charge-offs related to NPL sales in 2011 and 2010, respectively.
Noninterest income was $241 million in 2011, down $280 million, or 54%, from 2010. Total mortgage production income for the
year was a loss of $19 million, down $133 million from the prior year as loan production volume of $23.1 billion was down $6.2
billion, or 21%, from the prior year resulting in lower gain on sale and fee income. Mortgage loan repurchase provision was up
$46 million over the prior year due to higher agency-related repurchase requests.
Mortgage servicing income was down $134 million, or 37%, compared to 2010 due to less favorable net hedge performance,
which was negatively impacted by $38 million due to an increase in prepayment assumptions attributable to anticipated refinancing
activity arising from the HARP 2.0 program. Total loans serviced at December 31, 2011 were $157.8 billion compared with $167.2
billion the prior year, down 6%.