SunTrust 2011 Annual Report Download - page 130
Download and view the complete annual report
Please find page 130 of the 2011 SunTrust annual report below. You can navigate through the pages in the report by either clicking on the pages listed below, or by using the keyword search tool below to find specific information within the annual report.-
 1
1 -
2
-
3
-
4
-
5
-
6
-
7
-
8
-
9
-
10
-
11
-
12
-
13
-
14
-
15
-
16
-
17
-
18
-
19
-
20
-
21
-
22
-
23
-
24
-
25
-
26
-
27
-
28
-
29
-
30
-
31
-
32
-
33
-
34
-
35
-
36
-
37
-
38
-
39
-
40
-
41
-
42
-
43
-
44
-
45
-
46
-
47
-
48
-
49
-
50
-
51
-
52
-
53
-
54
-
55
-
56
-
57
-
58
-
59
-
60
-
61
-
62
-
63
-
64
-
65
-
66
-
67
-
68
-
69
-
70
-
71
-
72
-
73
-
74
-
75
-
76
-
77
-
78
-
79
-
80
-
81
-
82
-
83
-
84
-
85
-
86
-
87
-
88
-
89
-
90
-
91
-
92
-
93
-
94
-
95
-
96
-
97
-
98
-
99
-
100
-
101
-
102
-
103
-
104
-
105
-
106
-
107
-
108
-
109
-
110
-
111
-
112
-
113
-
114
-
115
-
116
-
117
-
118
-
119
-
 120
120 -
 121
121 -
 122
122 -
 123
123 -
 124
124 -
 125
125 -
 126
126 -
 127
127 -
 128
128 -
 129
129 -
 130
130 -
 131
131 -
 132
132 -
 133
133 -
 134
134 -
 135
135 -
 136
136 -
 137
137 -
 138
138 -
 139
139 -
 140
140 -
141
-
142
-
143
-
144
-
145
-
146
-
147
-
148
-
149
-
150
-
151
-
152
-
153
-
154
-
155
-
156
-
157
-
158
-
159
-
160
-
161
-
162
-
163
-
164
-
165
-
166
-
167
-
168
-
169
-
170
-
171
-
172
-
173
-
174
-
175
-
176
-
177
-
178
-
179
-
180
-
181
-
182
-
183
-
184
-
185
-
186
-
187
-
188
-
189
-
190
-
191
-
192
-
193
-
194
-
195
-
196
-
197
-
198
-
199
-
200
-
201
-
202
-
203
-
204
-
205
-
206
-
207
-
208
-
209
-
210
-
211
-
212
-
213
-
214
-
215
-
216
-
217
-
218
-
219
-
220
-
221
-
222
-
223
-
224
-
225
-
226
-
227
 |
 |
Notes to Consolidated Financial Statements (Continued)
114
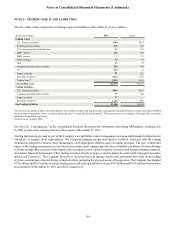
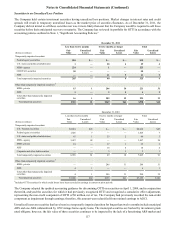
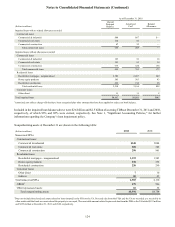
NOTE 4 - TRADING ASSETS AND LIABILITIES
The fair values of the components of trading assets and liabilities at December 31 were as follows:
(Dollars in millions)
Trading Assets
U.S. Treasury securities
Federal agency securities
U.S. states and political subdivisions
MBS - agency
MBS - private
CDO securities
ABS
Corporate and other debt securities
CP
Equity securities
Derivative contracts 1
Trading loans 2
Total trading assets
Trading Liabilities
U.S. Treasury securities
Corporate and other debt securities
Equity securities
Derivative contracts 1
Total trading liabilities
2011
$144
478
54
412
1
45
37
344
229
91
2,414
2,030
$6,279
$569
77
37
1,123
$1,806
2010
$187
361
123
301
15
55
59
743
14
221
2,743
1,353
$6,175
$439
398
—
1,841
$2,678
1The current year amount is offset with cash collateral received from or deposited with derivative counterparties when the derivative contracts are subject to ISDA
master netting arrangements, due to resolution during the year of certain operational limitations. This presentation is in accordance with applicable accounting
standards and applied prospectively.
2Includes loans related to TRS.
See Note 20, “Contingencies,” to the Consolidated Financial Statements for information concerning ARS added to trading assets
in 2008 as well as the current position in those assets at December 31, 2011.
Trading instruments are used as part of the Company’s overall balance sheet management strategies and through its broker/dealer
subsidiary, to support client requirements. The Company manages the potential market volatility associated with the trading
instruments, utilized for balance sheet management, with appropriate duration and/or hedging strategies. The size, volume and
nature of the trading instruments can vary based on economic and Company specific asset or liability conditions. Product offerings
to clients include debt securities, loans traded in the secondary market, equity securities, derivative and foreign exchange contracts,
and similar financial instruments. Other trading activities include acting as a market maker in certain debt and equity securities
and related derivatives. The Company has policies and procedures to manage market risk associated with these client trading
activities and assumes a limited degree of market risk by managing the size and nature of its exposure. The Company has pledged
$770 million and $823 million of certain trading assets and cash equivalents to secure $747 million and $793 million of repurchase
agreements as of December 31, 2011 and 2010, respectively.