SunTrust 2011 Annual Report Download - page 116
Download and view the complete annual report
Please find page 116 of the 2011 SunTrust annual report below. You can navigate through the pages in the report by either clicking on the pages listed below, or by using the keyword search tool below to find specific information within the annual report.-
 1
1 -
2
-
3
-
4
-
5
-
6
-
7
-
8
-
9
-
10
-
11
-
12
-
13
-
14
-
15
-
16
-
17
-
18
-
19
-
20
-
21
-
22
-
23
-
24
-
25
-
26
-
27
-
28
-
29
-
30
-
31
-
32
-
33
-
34
-
35
-
36
-
37
-
38
-
39
-
40
-
41
-
42
-
43
-
44
-
45
-
46
-
47
-
48
-
49
-
50
-
51
-
52
-
53
-
54
-
55
-
56
-
57
-
58
-
59
-
60
-
61
-
62
-
63
-
64
-
65
-
66
-
67
-
68
-
69
-
70
-
71
-
72
-
73
-
74
-
75
-
76
-
77
-
78
-
79
-
80
-
81
-
82
-
83
-
84
-
85
-
86
-
87
-
88
-
89
-
90
-
91
-
92
-
93
-
94
-
95
-
96
-
97
-
98
-
99
-
100
-
101
-
102
-
103
-
104
-
105
-
 106
106 -
 107
107 -
 108
108 -
 109
109 -
 110
110 -
 111
111 -
 112
112 -
 113
113 -
 114
114 -
 115
115 -
 116
116 -
 117
117 -
 118
118 -
 119
119 -
 120
120 -
 121
121 -
 122
122 -
 123
123 -
 124
124 -
 125
125 -
 126
126 -
127
-
128
-
129
-
130
-
131
-
132
-
133
-
134
-
135
-
136
-
137
-
138
-
139
-
140
-
141
-
142
-
143
-
144
-
145
-
146
-
147
-
148
-
149
-
150
-
151
-
152
-
153
-
154
-
155
-
156
-
157
-
158
-
159
-
160
-
161
-
162
-
163
-
164
-
165
-
166
-
167
-
168
-
169
-
170
-
171
-
172
-
173
-
174
-
175
-
176
-
177
-
178
-
179
-
180
-
181
-
182
-
183
-
184
-
185
-
186
-
187
-
188
-
189
-
190
-
191
-
192
-
193
-
194
-
195
-
196
-
197
-
198
-
199
-
200
-
201
-
202
-
203
-
204
-
205
-
206
-
207
-
208
-
209
-
210
-
211
-
212
-
213
-
214
-
215
-
216
-
217
-
218
-
219
-
220
-
221
-
222
-
223
-
224
-
225
-
226
-
227
 |
 |

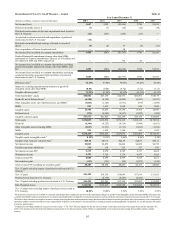
100
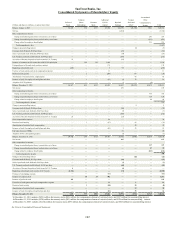
SunTrust Banks, Inc.
Consolidated Statements of Income/(Loss)
(Dollars in millions and shares in thousands, except per share data)
Interest Income
Interest and fees on loans
Interest and fees on loans held for sale
Interest and dividends on securities available for sale:
Taxable interest
Tax-exempt interest
Dividends1
Trading account interest and other
Total interest income
Interest Expense
Interest on deposits
Interest on long-term debt
Interest on other borrowings
Total interest expense
Net interest income
Provision for credit losses
Net interest income after provision for credit losses
Noninterest Income
Service charges on deposit accounts
Trust and investment management income
Other charges and fees
Card fees
Investment banking income
Trading income/(loss)
Retail investment services
Mortgage production related (loss)/income
Mortgage servicing related income
Net securities gains2
Gain from ownership in Visa
Other noninterest income
Total noninterest income
Noninterest Expense
Employee compensation
Employee benefits
Outside processing and software
Net occupancy expense
Regulatory assessments
Credit and collection services
Other real estate expense
Operating losses
Marketing and customer development
Equipment expense
Potential mortgage servicing settlement and claims expense
Amortization/impairment of goodwill/intangible assets
Net (gain)/loss on debt extinguishment
Other noninterest expense
Total noninterest expense
Income/(loss) before provision/(benefit) for income taxes
Provision/(benefit) for income taxes
Net income/(loss) including income attributable to noncontrolling interest
Net income attributable to noncontrolling interest
Net income/(loss)
Net income/(loss) available to common shareholders
Net income/(loss) per average common share
Diluted3
Basic
Dividends declared per common share
Average common shares - diluted
Average common shares - basic
Year Ended December 31
2011
$5,219
93
688
21
82
78
6,181
624
449
43
1,116
5,065
1,513
3,552
685
531
507
371
317
248
230
(5)
224
117
—
196
3,421
2,494
382
653
356
300
275
264
257
184
178
120
43
(3)
731
6,234
739
79
660
13
$647
$495
$0.94
0.94
$0.12
527,618
523,995
2010
$5,300
137
709
31
76
90
6,343
860
580
49
1,489
4,854
2,651
2,203
760
503
534
376
313
173
205
127
358
191
—
189
3,729
2,364
457
638
361
265
279
300
83
177
174
—
51
70
692
5,911
21
(185)
206
17
$189
($87)
($0.18)
(0.18)
$0.04
498,744
495,361
2009
$5,530
233
717
40
73
117
6,710
1,440
761
43
2,244
4,466
4,064
402
848
486
523
324
272
(41)
218
376
330
98
112
164
3,710
2,258
542
579
357
302
259
244
99
152
172
—
807
39
752
6,562
(2,450)
(898)
(1,552)
12
($1,564)
($1,733)
($3.98)
(3.98)
$0.22
437,486
435,328
1Includes dividends on common stock of The Coca-Cola Company of $56 million, $53 million, and $49 million during the years ended December 31, 2011, 2010, and 2009, respectively.
2Includes credit-related other-than-temporary impairment losses of $6 million, $2 million, and $20 million, consisting of $7 million, $2 million, and $113 million of total unrealized losses, net of
$1 million, $0, and $93 million of non-credit related unrealized losses recorded in other comprehensive income, before taxes, for the years ended December 31, 2011, 2010, and 2009, respectively.
3For earnings per share calculation purposes, the impact of dilutive securities are excluded from the diluted share count during periods that the Company has recognized a net loss available to
common shareholders because the impact would be anti-dilutive.
See Notes to Consolidated Financial Statements.