SunTrust 2011 Annual Report Download - page 96
Download and view the complete annual report
Please find page 96 of the 2011 SunTrust annual report below. You can navigate through the pages in the report by either clicking on the pages listed below, or by using the keyword search tool below to find specific information within the annual report.-
 1
1 -
2
-
3
-
4
-
5
-
6
-
7
-
8
-
9
-
10
-
11
-
12
-
13
-
14
-
15
-
16
-
17
-
18
-
19
-
20
-
21
-
22
-
23
-
24
-
25
-
26
-
27
-
28
-
29
-
30
-
31
-
32
-
33
-
34
-
35
-
36
-
37
-
38
-
39
-
40
-
41
-
42
-
43
-
44
-
45
-
46
-
47
-
48
-
49
-
50
-
51
-
52
-
53
-
54
-
55
-
56
-
57
-
58
-
59
-
60
-
61
-
62
-
63
-
64
-
65
-
66
-
67
-
68
-
69
-
70
-
71
-
72
-
73
-
74
-
75
-
76
-
77
-
78
-
79
-
80
-
81
-
82
-
83
-
84
-
85
-
 86
86 -
 87
87 -
 88
88 -
 89
89 -
 90
90 -
 91
91 -
 92
92 -
 93
93 -
 94
94 -
 95
95 -
 96
96 -
 97
97 -
 98
98 -
 99
99 -
 100
100 -
 101
101 -
 102
102 -
 103
103 -
 104
104 -
 105
105 -
 106
106 -
107
-
108
-
109
-
110
-
111
-
112
-
113
-
114
-
115
-
116
-
117
-
118
-
119
-
120
-
121
-
122
-
123
-
124
-
125
-
126
-
127
-
128
-
129
-
130
-
131
-
132
-
133
-
134
-
135
-
136
-
137
-
138
-
139
-
140
-
141
-
142
-
143
-
144
-
145
-
146
-
147
-
148
-
149
-
150
-
151
-
152
-
153
-
154
-
155
-
156
-
157
-
158
-
159
-
160
-
161
-
162
-
163
-
164
-
165
-
166
-
167
-
168
-
169
-
170
-
171
-
172
-
173
-
174
-
175
-
176
-
177
-
178
-
179
-
180
-
181
-
182
-
183
-
184
-
185
-
186
-
187
-
188
-
189
-
190
-
191
-
192
-
193
-
194
-
195
-
196
-
197
-
198
-
199
-
200
-
201
-
202
-
203
-
204
-
205
-
206
-
207
-
208
-
209
-
210
-
211
-
212
-
213
-
214
-
215
-
216
-
217
-
218
-
219
-
220
-
221
-
222
-
223
-
224
-
225
-
226
-
227
 |
 |

80
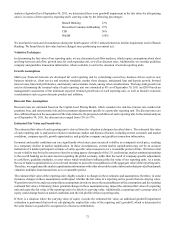
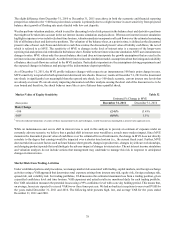
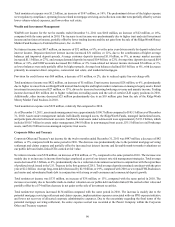
Contingent Liquidity Sources
(Dollars in billions)
Excess reserves
Free and liquid investment portfolio securities
FHLB borrowing capacity
Discount window borrowing capacity
Total
December 31, 2011
As of
$0.7
14.5
10.8
15.2
$41.2
Average for the
Year Ended ¹
$2.6
17.1
13.0
14.1
$46.8
December 31, 2010
As of
$1.7
16.2
12.6
12.5
$43.0
Table 34
Average for the
Year Ended ¹
$2.3
18.0
9.1
11.9
$41.3
1Average based upon month-end data, except excess reserves, which is based upon a daily average.
Uses of Funds. Our primary uses of funds include the extension of loans and credit, the purchase of investment securities, working
capital, and debt and capital service. The Bank and the Parent Company borrow in the money markets using instruments such as
Fed funds, Eurodollars, and CP. As of December 31, 2011, the Parent Company had no CP outstanding and the Bank retained a
material cash position in the form of excess reserves in its Federal Reserve account. In the absence of robust loan demand, we
have chosen to deploy some of this excess liquidity to purchase and retire certain high-cost debt securities or other borrowings.
During the year ended December 31, 2011, pursuant to a capital plan submitted to the Federal Reserve, we repurchased high-cost
Tier 1 capital securities, including certain Trust Preferred Securities and $4.9 billion of our Series C and Series D Fixed Rate
Cumulative Preferred stock issued to the U.S. Treasury under the TARP’s CPP. Despite these transactions, the Parent Company
retains a material cash position, in accordance with Company policies and risk limits discussed in greater detail below.
Additionally, contingent uses of funds may arise from events such as financial market disruptions or credit rating downgrades.
Factors that affect our credit ratings include, but are not limited to, the credit risk profile of our assets, the adequacy of our ALLL,
the level and stability of our earnings, the liquidity profile of both the Bank and the Parent Company, the economic environment,
and the adequacy of our capital base. As of December 31, 2011, Moody’s, S&P, and DBRS all maintained a “Stable” outlook on
our credit ratings, while Fitch maintained a “Positive” outlook, citing improved credit and earnings trends. Future credit rating
downgrades are possible, although not currently anticipated given the “Stable” and “Positive” credit rating outlooks.
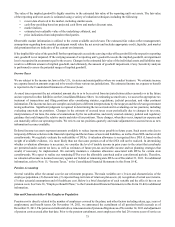
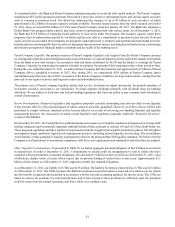
Debt Credit Ratings and Outlook
SunTrust Banks, Inc.
Short-term
Senior long-term
SunTrust Bank
Short-term
Senior long-term
Outlook
As of December 31, 2011
Moody’s
P-2
Baa1
P-2
A3
Stable
S&P
A-2
BBB
A-2
BBB+
Stable
Fitch
F2
BBB+
F2
BBB+
Positive
Table 35
DBRS
R-1 (low)
A (low)
R-1 (low)
A
Stable
Sources of Funds. Our primary source of funds is a large, stable retail deposit base. Core deposits, predominantly made up of
consumer and commercial deposits, are primarily gathered from our retail branch network and are our largest, most cost-effective
source of funding. Core deposits increased to $125.6 billion as of December 31, 2011, from $120.0 billion as of December 31,
2010.
We also maintain access to a diversified collection of both secured and unsecured wholesale funding sources. These uncommitted
sources include Fed funds purchased from other banks, securities sold under agreements to repurchase, negotiable CDs, offshore
deposits, FHLB advances, Global Bank Notes, and CP. Aggregate wholesale funding decreased to $17.5 billion as of December 31,
2011, from $22.9 billion as of December 31, 2010. Approximately $4.1 billion of wholesale debt matured during the year ended
December 31, 2011 and was redeemed at par. Net short-term unsecured borrowings, which includes wholesale domestic and
foreign deposits and Fed funds purchased, decreased to $5.1 billion as of December 31, 2011, from $7.1 billion as of December 31,
2010.