SunTrust 2011 Annual Report Download - page 118
Download and view the complete annual report
Please find page 118 of the 2011 SunTrust annual report below. You can navigate through the pages in the report by either clicking on the pages listed below, or by using the keyword search tool below to find specific information within the annual report.-
 1
1 -
2
-
3
-
4
-
5
-
6
-
7
-
8
-
9
-
10
-
11
-
12
-
13
-
14
-
15
-
16
-
17
-
18
-
19
-
20
-
21
-
22
-
23
-
24
-
25
-
26
-
27
-
28
-
29
-
30
-
31
-
32
-
33
-
34
-
35
-
36
-
37
-
38
-
39
-
40
-
41
-
42
-
43
-
44
-
45
-
46
-
47
-
48
-
49
-
50
-
51
-
52
-
53
-
54
-
55
-
56
-
57
-
58
-
59
-
60
-
61
-
62
-
63
-
64
-
65
-
66
-
67
-
68
-
69
-
70
-
71
-
72
-
73
-
74
-
75
-
76
-
77
-
78
-
79
-
80
-
81
-
82
-
83
-
84
-
85
-
86
-
87
-
88
-
89
-
90
-
91
-
92
-
93
-
94
-
95
-
96
-
97
-
98
-
99
-
100
-
101
-
102
-
103
-
104
-
105
-
106
-
107
-
 108
108 -
 109
109 -
 110
110 -
 111
111 -
 112
112 -
 113
113 -
 114
114 -
 115
115 -
 116
116 -
 117
117 -
 118
118 -
 119
119 -
 120
120 -
 121
121 -
 122
122 -
 123
123 -
 124
124 -
 125
125 -
 126
126 -
 127
127 -
 128
128 -
129
-
130
-
131
-
132
-
133
-
134
-
135
-
136
-
137
-
138
-
139
-
140
-
141
-
142
-
143
-
144
-
145
-
146
-
147
-
148
-
149
-
150
-
151
-
152
-
153
-
154
-
155
-
156
-
157
-
158
-
159
-
160
-
161
-
162
-
163
-
164
-
165
-
166
-
167
-
168
-
169
-
170
-
171
-
172
-
173
-
174
-
175
-
176
-
177
-
178
-
179
-
180
-
181
-
182
-
183
-
184
-
185
-
186
-
187
-
188
-
189
-
190
-
191
-
192
-
193
-
194
-
195
-
196
-
197
-
198
-
199
-
200
-
201
-
202
-
203
-
204
-
205
-
206
-
207
-
208
-
209
-
210
-
211
-
212
-
213
-
214
-
215
-
216
-
217
-
218
-
219
-
220
-
221
-
222
-
223
-
224
-
225
-
226
-
227
 |
 |

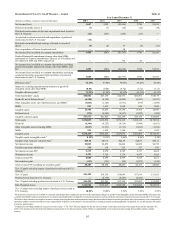
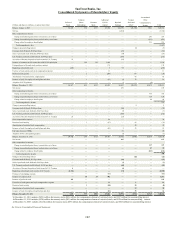
102
SunTrust Banks, Inc.
Consolidated Statements of Shareholders’ Equity
(Dollars and shares in millions, except per share data)
Balance, January 1, 2009
Net loss
Other comprehensive income:
Change in unrealized gains (losses) on securities, net of taxes
Change in unrealized gains (losses) on derivatives, net of taxes
Change related to employee benefit plans
Total comprehensive loss
Change in noncontrolling interest
Common stock dividends, $0.22 per share
Series A preferred stock dividends, $4,056 per share
U.S. Treasury preferred stock dividends, $5,004 per share
Accretion of discount for preferred stock issued to U.S. Treasury
Issuance of common stock in connection with SCAP capital plan
Extinguishment of forward stock purchase contract
Repurchase of preferred stock
Exercise of stock options and stock compensation expense
Restricted stock activity
Amortization of restricted stock compensation
Issuance of stock for employee benefit plans and other
Adoption of OTTI guidance
Balance, December 31, 2009
Net income
Other comprehensive income:
Change in unrealized gains (losses) on securities, net of taxes
Change in unrealized gains (losses) on derivatives, net of taxes
Change related to employee benefit plans
Total comprehensive income
Change in noncontrolling interest
Common stock dividends, $0.04 per share
Series A preferred stock dividends, $4,056 per share
U.S. Treasury preferred stock dividends, $5,000 per share
Accretion of discount for preferred stock issued to U.S. Treasury
Stock compensation expense
Restricted stock activity
Amortization of restricted stock compensation
Issuance of stock for employee benefit plans and other
Fair value election of MSRs
Adoption of VIE consolidation guidance
Balance, December 31, 2010
Net income
Other comprehensive income:
Change in unrealized gains (losses) on securities, net of taxes
Change in unrealized gains (losses) on derivatives, net of taxes
Change related to employee benefit plans
Total comprehensive income
Change in noncontrolling interest
Common stock dividends, $0.12 per share
Series A preferred stock dividends, $4,056 per share
U.S. Treasury preferred stock dividends, $1,236 per share
Accretion of discount for preferred stock issued to U.S. Treasury
Repurchase of preferred stock issued to U.S. Treasury
Purchase of outstanding warrants
Issuance of common stock
Issuance of preferred stock
Excercise of stock options and stock compensation expense
Restricted stock activity
Amortization of restricted stock compensation
Issuance of stock for employee benefit plans and other
Balance, December 31, 2011
Preferred
Stock
$5,222
—
—
—
—
—
—
—
—
23
—
—
(328)
—
—
—
—
—
$4,917
—
—
—
—
—
—
—
—
25
—
—
—
—
—
—
$4,942
—
—
—
—
—
—
—
—
6
(4,776)
—
—
103
—
—
—
—
$275
Common
Shares
Outstanding
354
—
—
—
—
—
—
—
—
—
142
—
—
—
2
—
1
—
499
—
—
—
—
—
—
—
—
—
—
1
—
—
—
—
500
—
—
—
—
—
—
—
—
—
—
—
35
—
—
1
—
1
537
Common
Stock
$373
—
—
—
—
—
—
—
—
—
142
—
—
—
—
—
—
—
$515
—
—
—
—
—
—
—
—
—
—
—
—
—
—
—
$515
—
—
—
—
—
—
—
—
—
—
—
35
—
—
—
—
—
$550
Additional
Paid in
Capital
$6,904
—
—
—
—
—
—
—
—
—
1,688
174
5
11
(206)
—
(55)
—
$8,521
—
—
—
—
—
—
—
—
—
24
(97)
—
(45)
—
—
$8,403
—
—
—
—
—
—
—
—
—
—
(11)
982
—
11
(58)
—
(21)
$9,306
Retained
Earnings
$10,389
(1,564)
—
—
—
—
(83)
(14)
(243)
(23)
—
—
95
—
—
—
(2)
8
$8,563
189
—
—
—
—
(20)
(7)
(242)
(25)
—
—
—
2
89
(7)
$8,542
647
—
—
—
—
(64)
(7)
(60)
(6)
(74)
—
—
—
—
—
—
—
$8,978
Treasury
Stock and
Other1
($1,368)
—
—
—
—
(5)
—
—
—
—
—
—
—
—
177
66
75
—
($1,055)
—
—
—
—
4
—
—
—
—
—
66
42
55
—
—
($888)
—
—
—
—
(22)
—
—
—
—
—
—
—
—
1
50
32
35
($792)
Accumulated
Other
Comprehensive
Income
$981
—
281
(435)
251
—
—
—
—
—
—
—
—
—
—
—
—
(8)
$1,070
—
366
120
60
—
—
—
—
—
—
—
—
—
—
$1,616
—
337
37
(241)
—
—
—
—
—
—
—
—
—
—
—
—
—
$1,749
Total
$22,501
(1,564)
281
(435)
251
(1,467)
(5)
(83)
(14)
(243)
—
1,830
174
(228)
11
(29)
66
18
—
$22,531
189
366
120
60
735
4
(20)
(7)
(242)
—
24
(31)
42
12
89
(7)
$23,130
647
337
37
(241)
780
(22)
(64)
(7)
(60)
—
(4,850)
(11)
1,017
103
12
(8)
32
14
$20,066
1 At December 31, 2011 includes ($851) million for treasury stock, ($48) million for compensation element of restricted stock, and $107 million for noncontrolling interest.
At December 31, 2010 includes ($974) million for treasury stock, ($43) million for compensation element of restricted stock, and $129 million for noncontrolling interest.
At December 31, 2009 includes ($1,104) million for treasury stock, ($59) million for compensation element of restricted stock, and $108 million for noncontrolling interest.
See Notes to Consolidated Financial Statements.