SunTrust 2011 Annual Report Download - page 54
Download and view the complete annual report
Please find page 54 of the 2011 SunTrust annual report below. You can navigate through the pages in the report by either clicking on the pages listed below, or by using the keyword search tool below to find specific information within the annual report.-
 1
1 -
2
-
3
-
4
-
5
-
6
-
7
-
8
-
9
-
10
-
11
-
12
-
13
-
14
-
15
-
16
-
17
-
18
-
19
-
20
-
21
-
22
-
23
-
24
-
25
-
26
-
27
-
28
-
29
-
30
-
31
-
32
-
33
-
34
-
35
-
36
-
37
-
38
-
39
-
40
-
41
-
42
-
43
-
 44
44 -
 45
45 -
 46
46 -
 47
47 -
 48
48 -
 49
49 -
 50
50 -
 51
51 -
 52
52 -
 53
53 -
 54
54 -
 55
55 -
 56
56 -
 57
57 -
 58
58 -
 59
59 -
 60
60 -
 61
61 -
 62
62 -
 63
63 -
 64
64 -
65
-
66
-
67
-
68
-
69
-
70
-
71
-
72
-
73
-
74
-
75
-
76
-
77
-
78
-
79
-
80
-
81
-
82
-
83
-
84
-
85
-
86
-
87
-
88
-
89
-
90
-
91
-
92
-
93
-
94
-
95
-
96
-
97
-
98
-
99
-
100
-
101
-
102
-
103
-
104
-
105
-
106
-
107
-
108
-
109
-
110
-
111
-
112
-
113
-
114
-
115
-
116
-
117
-
118
-
119
-
120
-
121
-
122
-
123
-
124
-
125
-
126
-
127
-
128
-
129
-
130
-
131
-
132
-
133
-
134
-
135
-
136
-
137
-
138
-
139
-
140
-
141
-
142
-
143
-
144
-
145
-
146
-
147
-
148
-
149
-
150
-
151
-
152
-
153
-
154
-
155
-
156
-
157
-
158
-
159
-
160
-
161
-
162
-
163
-
164
-
165
-
166
-
167
-
168
-
169
-
170
-
171
-
172
-
173
-
174
-
175
-
176
-
177
-
178
-
179
-
180
-
181
-
182
-
183
-
184
-
185
-
186
-
187
-
188
-
189
-
190
-
191
-
192
-
193
-
194
-
195
-
196
-
197
-
198
-
199
-
200
-
201
-
202
-
203
-
204
-
205
-
206
-
207
-
208
-
209
-
210
-
211
-
212
-
213
-
214
-
215
-
216
-
217
-
218
-
219
-
220
-
221
-
222
-
223
-
224
-
225
-
226
-
227
 |
 |

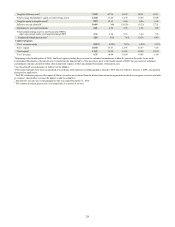
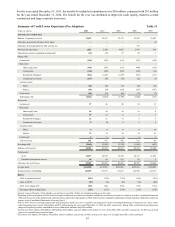
38
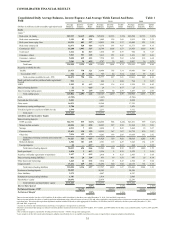
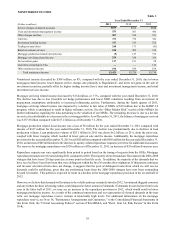
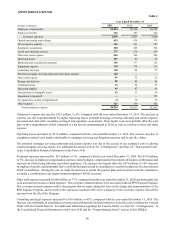
NONINTEREST INCOME
(Dollars in millions)
Service charges on deposit accounts
Trust and investment management income
Other charges and fees
Card fees
Investment banking income
Trading income/(loss)
Retail investment services
Mortgage production related (loss)/income
Mortgage servicing related income
Net securities gains
Gain from ownership in Visa
Other noninterest income
Total noninterest income
Year Ended December 31
2011
$685
531
507
371
317
248
230
(5)
224
117
—
196
$3,421
2010
$760
503
534
376
313
173
205
127
358
191
—
189
$3,729
Table 3
2009
$848
486
523
324
272
(41)
218
376
330
98
112
164
$3,710
Noninterest income decreased by $308 million, or 8%, compared with the year ended December 31, 2010, due to lower
mortgage-related income, lower deposit service charges due primarily to Regulation E, and lower net gains on the sale of
investment securities, partially offset by higher trading income/(loss), trust and investment management income, and retail
investment services income.
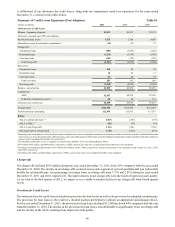
Mortgage servicing related income decreased by $134 million, or 37%, compared with the year ended December 31, 2010.
The decline was due to less favorable net hedge performance and lower MSR valuations resulting from an increase in
prepayment assumptions attributable to increased refinancing activity. Furthermore, during the fourth quarter of 2011,
mortgage servicing related income was impacted by a decline in fair value of MSRs of $38 million due to the HARP 2.0
program, which is anticipated to result in higher refinance activity. See the “Other Market Risk” section of this MD&A for
further information regarding the risks pertaining to the valuation of our MSRs. The remaining decrease is due to a decline
in service fees attributable to a decrease in the servicing portfolio. As of December 31, 2011, the balance of mortgages serviced
was $157.8 billion compared with $167.2 billion as of December 31, 2010.
Mortgage production related (loss)/income was a loss of $5 million for the year ended December 31, 2011 compared with
income of $127 million for the year ended December 31, 2010. The decline was predominantly due to declines in loan
production volume. Loan production volume of $23.1 billion in 2011 was down $6.2 billion, or 21%, from the prior year,
coupled with lower margins, which resulted in lower gain on sale and fee income. Additionally, the mortgage repurchase
provision for the year ended December 31, 2011 was $502 million compared with $456 million for the year ended December 31,
2010, an increase of $46 million due to the increase in agency-related repurchase requests (see below for additional discussion).
The reserves for mortgage repurchases was $320 million as of December 31, 2011, an increase of $55 million from prior year.
Repurchase requests can vary significantly from period to period based on the timing of requests from the GSEs. Mortgage
repurchase demands were elevated during 2011 compared to 2010. The majority of our demands are from loans in the 2006-2008
vintages that have been 120 days past due at some point in their life cycle. In addition, the majority of the demands that we
have received have been from loans that were delinquent within the first 36 months after origination. If this pattern continues
and investor selection criteria does not change, it suggests that the pool of delinquent loans from which we will receive
demands could be stabilizing, given that any performing loans from the 2006-2008 vintages have now been outstanding
beyond 36 months. This pattern is expected to result in a decline in the mortgage repurchase provision in the second half of
2012.
However, we believe that demands will continue to be volatile and may remain elevated in 2012. A continued sluggish economy
and any further declines in housing values could impact the future amount of demands. If demands do not decline from levels
seen in the latter half of 2011, we may see an increase in the repurchase provision in 2012, which would result in lower
mortgage production income. As a result of the continued uncertainty and our expectation of elevated demands in the near
term, our mortgage repurchase reserve remains at historically high levels. For additional information on the mortgage
repurchase reserve, see Note 18, "Reinsurance Arrangements and Guarantees," to the Consolidated Financial Statements in
this Form 10-K, the "Critical Accounting Policies" section of this MD&A, and "Part I, Item 1A, Risk Factors" in this Form
10-K.