SunTrust 2011 Annual Report Download - page 136
Download and view the complete annual report
Please find page 136 of the 2011 SunTrust annual report below. You can navigate through the pages in the report by either clicking on the pages listed below, or by using the keyword search tool below to find specific information within the annual report.-
 1
1 -
2
-
3
-
4
-
5
-
6
-
7
-
8
-
9
-
10
-
11
-
12
-
13
-
14
-
15
-
16
-
17
-
18
-
19
-
20
-
21
-
22
-
23
-
24
-
25
-
26
-
27
-
28
-
29
-
30
-
31
-
32
-
33
-
34
-
35
-
36
-
37
-
38
-
39
-
40
-
41
-
42
-
43
-
44
-
45
-
46
-
47
-
48
-
49
-
50
-
51
-
52
-
53
-
54
-
55
-
56
-
57
-
58
-
59
-
60
-
61
-
62
-
63
-
64
-
65
-
66
-
67
-
68
-
69
-
70
-
71
-
72
-
73
-
74
-
75
-
76
-
77
-
78
-
79
-
80
-
81
-
82
-
83
-
84
-
85
-
86
-
87
-
88
-
89
-
90
-
91
-
92
-
93
-
94
-
95
-
96
-
97
-
98
-
99
-
100
-
101
-
102
-
103
-
104
-
105
-
106
-
107
-
108
-
109
-
110
-
111
-
112
-
113
-
114
-
115
-
116
-
117
-
118
-
119
-
120
-
121
-
122
-
123
-
124
-
125
-
 126
126 -
 127
127 -
 128
128 -
 129
129 -
 130
130 -
 131
131 -
 132
132 -
 133
133 -
 134
134 -
 135
135 -
 136
136 -
 137
137 -
 138
138 -
 139
139 -
 140
140 -
 141
141 -
 142
142 -
 143
143 -
 144
144 -
 145
145 -
 146
146 -
147
-
148
-
149
-
150
-
151
-
152
-
153
-
154
-
155
-
156
-
157
-
158
-
159
-
160
-
161
-
162
-
163
-
164
-
165
-
166
-
167
-
168
-
169
-
170
-
171
-
172
-
173
-
174
-
175
-
176
-
177
-
178
-
179
-
180
-
181
-
182
-
183
-
184
-
185
-
186
-
187
-
188
-
189
-
190
-
191
-
192
-
193
-
194
-
195
-
196
-
197
-
198
-
199
-
200
-
201
-
202
-
203
-
204
-
205
-
206
-
207
-
208
-
209
-
210
-
211
-
212
-
213
-
214
-
215
-
216
-
217
-
218
-
219
-
220
-
221
-
222
-
223
-
224
-
225
-
226
-
227
 |
 |
Notes to Consolidated Financial Statements (Continued)
120
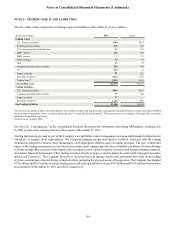
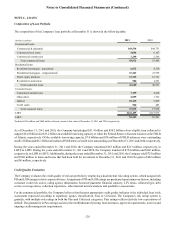
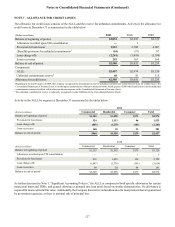
NOTE 6 - LOANS
Composition of Loan Portfolio
The composition of the Company's loan portfolio at December 31 is shown in the following table:
(Dollars in millions)
Commercial loans:
Commercial & industrial
Commercial real estate
Commercial construction
Total commercial loans
Residential loans:
Residential mortgages - guaranteed
Residential mortgages - nonguaranteed1
Home equity products
Residential construction
Total residential loans
Consumer loans:
Guaranteed student loans
Other direct
Indirect
Credit cards
Total consumer loans
LHFI
LHFS
2011
$49,538
5,094
1,240
55,872
6,672
23,243
15,765
980
46,660
7,199
2,059
10,165
540
19,963
$122,495
$2,353
2010
$44,753
6,167
2,568
53,488
4,520
23,959
16,751
1,291
46,521
4,260
1,722
9,499
485
15,966
$115,975
$3,501
1Includes $431 million and $488 million of loans carried at fair value at December 31, 2011 and 2010, respectively.
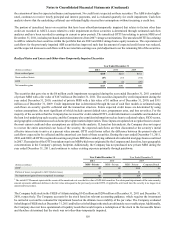
As of December 31, 2011 and 2010, the Company had pledged $51.4 billion and $50.2 billion of net eligible loan collateral to
support $34.8 billion and $31.2 billion in available borrowing capacity at either the Federal Reserve discount window or the FHLB
of Atlanta, respectively. Of the available borrowing capacity, $7.0 billion and $34 million of FHLB advances were outstanding
and $1.8 billion and $6.1 billion of undrawn FHLB letters of credit were outstanding as of December 31, 2011 and 2010, respectively.
During the years ended December 31, 2011 and 2010, the Company transferred $63 million and $213 million, respectively, in
LHFS to LHFI. During the years ended December 31, 2011 and 2010, the Company transferred $754 million and $346 million,
respectively, in LHFI to LHFS. Additionally, during the years ended December 31, 2011 and 2010, the Company sold $725 million
and $740 million in loans and leases that had been held for investment at December 31, 2011 and 2010 for gains of $22 million
and $6 million, respectively.
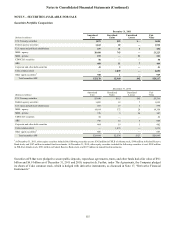
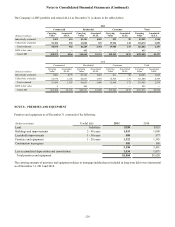
Credit Quality Evaluation
The Company evaluates the credit quality of its loan portfolio by employing a dual internal risk rating system, which assigns both
PD and LGD ratings to derive expected losses. Assignment of PD and LGD ratings are predicated upon numerous factors, including
consumer credit risk scores, rating agency information, borrower/guarantor financial capacity, LTV ratios, collateral type, debt
service coverage ratios, collection experience, other internal metrics/analysis and qualitative assessments.
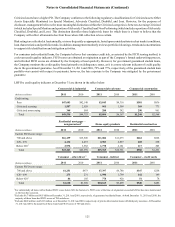
For the commercial portfolio, the Company believes that the most appropriate credit quality indicator is the individual loan’s risk
assessment expressed according to regulatory agency classification, Pass or Criticized. The Company's risk rating system is
granular, with multiple risk ratings in both the Pass and Criticized categories. Pass ratings reflect relatively low expectations of
default. The granularity in Pass ratings assists in the establishment of pricing, loan structures, approval requirements, reserves and
ongoing credit management requirements.