SunTrust 2011 Annual Report Download - page 137
Download and view the complete annual report
Please find page 137 of the 2011 SunTrust annual report below. You can navigate through the pages in the report by either clicking on the pages listed below, or by using the keyword search tool below to find specific information within the annual report.-
 1
1 -
2
-
3
-
4
-
5
-
6
-
7
-
8
-
9
-
10
-
11
-
12
-
13
-
14
-
15
-
16
-
17
-
18
-
19
-
20
-
21
-
22
-
23
-
24
-
25
-
26
-
27
-
28
-
29
-
30
-
31
-
32
-
33
-
34
-
35
-
36
-
37
-
38
-
39
-
40
-
41
-
42
-
43
-
44
-
45
-
46
-
47
-
48
-
49
-
50
-
51
-
52
-
53
-
54
-
55
-
56
-
57
-
58
-
59
-
60
-
61
-
62
-
63
-
64
-
65
-
66
-
67
-
68
-
69
-
70
-
71
-
72
-
73
-
74
-
75
-
76
-
77
-
78
-
79
-
80
-
81
-
82
-
83
-
84
-
85
-
86
-
87
-
88
-
89
-
90
-
91
-
92
-
93
-
94
-
95
-
96
-
97
-
98
-
99
-
100
-
101
-
102
-
103
-
104
-
105
-
106
-
107
-
108
-
109
-
110
-
111
-
112
-
113
-
114
-
115
-
116
-
117
-
118
-
119
-
120
-
121
-
122
-
123
-
124
-
125
-
126
-
 127
127 -
 128
128 -
 129
129 -
 130
130 -
 131
131 -
 132
132 -
 133
133 -
 134
134 -
 135
135 -
 136
136 -
 137
137 -
 138
138 -
 139
139 -
 140
140 -
 141
141 -
 142
142 -
 143
143 -
 144
144 -
 145
145 -
 146
146 -
 147
147 -
148
-
149
-
150
-
151
-
152
-
153
-
154
-
155
-
156
-
157
-
158
-
159
-
160
-
161
-
162
-
163
-
164
-
165
-
166
-
167
-
168
-
169
-
170
-
171
-
172
-
173
-
174
-
175
-
176
-
177
-
178
-
179
-
180
-
181
-
182
-
183
-
184
-
185
-
186
-
187
-
188
-
189
-
190
-
191
-
192
-
193
-
194
-
195
-
196
-
197
-
198
-
199
-
200
-
201
-
202
-
203
-
204
-
205
-
206
-
207
-
208
-
209
-
210
-
211
-
212
-
213
-
214
-
215
-
216
-
217
-
218
-
219
-
220
-
221
-
222
-
223
-
224
-
225
-
226
-
227
 |
 |
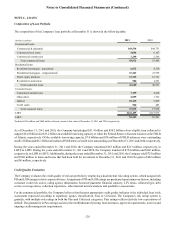
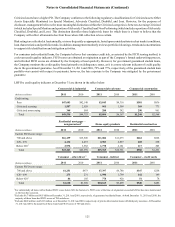
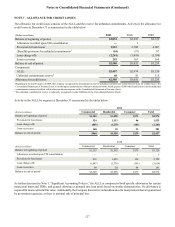
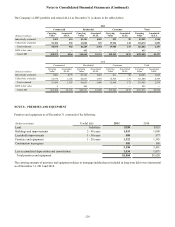
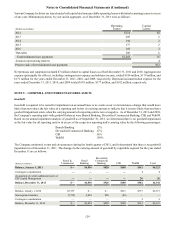
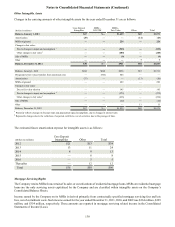
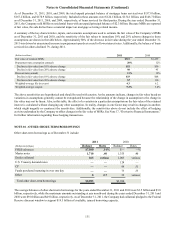
Notes to Consolidated Financial Statements (Continued)
121
Criticized assets have a higher PD. The Company conforms to the following regulatory classifications for Criticized assets: Other
Assets Especially Mentioned (or Special Mention), Adversely Classified, Doubtful, and Loss. However, for the purposes of
disclosure, management believes the most meaningful distinction within the Criticized categories is between Accruing Criticized
(which includes Special Mention and a portion of Adversely Classified) and Non-Performing (which includes a portion of Adversely
Classified, Doubtful, and Loss). This distinction identifies those higher risk loans for which there is a basis to believe that the
Company will collect all amounts due from those where full collection is less certain.
Risk ratings are refreshed at least annually, or more frequently as appropriate, based upon considerations such as market conditions,
loan characteristics and portfolio trends. In addition, management routinely reviews portfolio risk ratings, trends and concentrations
to support risk identification and mitigation activities.
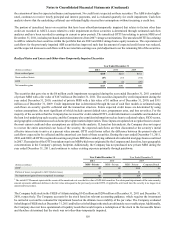
For consumer and residential loans, the Company believes that consumer credit risk, as assessed by the FICO scoring method, is
a relevant credit quality indicator. FICO scores are obtained at origination as part of the Company’s formal underwriting process,
and refreshed FICO scores are obtained by the Company at least quarterly. However, for government guaranteed student loans,
the Company monitors the credit quality based primarily on delinquency status, as it is a more relevant indicator of credit quality
due to the government guarantee. As of December 31, 2011 and 2010, 79% and 77%, respectively, of the guaranteed student loan
portfolio was current with respect to payments; however, the loss exposure to the Company was mitigated by the government
guarantee.
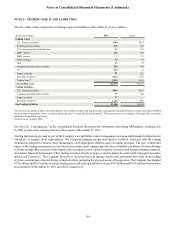
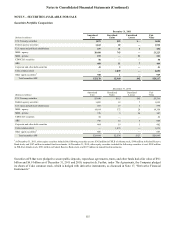
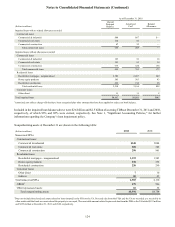
LHFI by credit quality indicator at December 31 are shown in the tables below:
(Dollars in millions)
Credit rating:
Pass
Criticized accruing
Criticized nonaccruing
Total
Commercial & industrial
2011
$47,683
1,507
348
$49,538
2010
$42,140
2,029
584
$44,753
Commercial real estate
2011
$3,845
961
288
$5,094
2010
$4,316
1,509
342
$6,167
Commercial construction
2011
$581
369
290
$1,240
2010
$836
771
961
$2,568
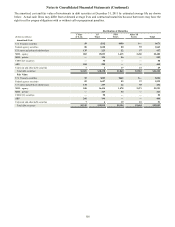
(Dollars in millions)
Current FICO score range:
700 and above
620 - 699
Below 6201
Total
Residential mortgages -
nonguaranteed 2
2011
$16,139
4,132
2,972
$23,243
2010
$15,920
4,457
3,582
$23,959
Home equity products
2011
$11,084
2,903
1,778
$15,765
2010
$11,673
2,897
2,181
$16,751
Residential construction
2011
$661
202
117
$980
2010
$828
258
205
$1,291
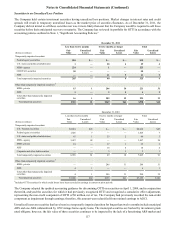
(Dollars in millions)
Current FICO score range:
700 and above
620 - 699
Below 6201
Total
Consumer - other direct 3
2011
$1,251
273
86
$1,610
2010
$973
231
105
$1,309
Consumer - indirect
2011
$7,397
1,990
778
$10,165
2010
$6,780
1,799
920
$9,499
Consumer - credit cards
2011
$347
142
51
$540
2010
$258
149
78
$485
1For substantially all loans with refreshed FICO scores below 620, the borrower’s FICO score at the time of origination exceeded 620 but has since deteriorated
as the loan has seasoned.
2Excludes $6.7 billion and $4.5 billion at December 31, 2011 and 2010, respectively, of guaranteed residential loans. At both December 31, 2011 and 2010, the
majority of these loans had FICO scores of 700 and above.
3Excludes $449 million and $413 million as of December 31, 2011 and 2010, respectively, of private-label student loans with third party insurance. At December
31, 2011 and 2010, the majority of these loans had FICO scores of 700 and above.