SunTrust 2011 Annual Report Download - page 117
Download and view the complete annual report
Please find page 117 of the 2011 SunTrust annual report below. You can navigate through the pages in the report by either clicking on the pages listed below, or by using the keyword search tool below to find specific information within the annual report.-
 1
1 -
2
-
3
-
4
-
5
-
6
-
7
-
8
-
9
-
10
-
11
-
12
-
13
-
14
-
15
-
16
-
17
-
18
-
19
-
20
-
21
-
22
-
23
-
24
-
25
-
26
-
27
-
28
-
29
-
30
-
31
-
32
-
33
-
34
-
35
-
36
-
37
-
38
-
39
-
40
-
41
-
42
-
43
-
44
-
45
-
46
-
47
-
48
-
49
-
50
-
51
-
52
-
53
-
54
-
55
-
56
-
57
-
58
-
59
-
60
-
61
-
62
-
63
-
64
-
65
-
66
-
67
-
68
-
69
-
70
-
71
-
72
-
73
-
74
-
75
-
76
-
77
-
78
-
79
-
80
-
81
-
82
-
83
-
84
-
85
-
86
-
87
-
88
-
89
-
90
-
91
-
92
-
93
-
94
-
95
-
96
-
97
-
98
-
99
-
100
-
101
-
102
-
103
-
104
-
105
-
106
-
 107
107 -
 108
108 -
 109
109 -
 110
110 -
 111
111 -
 112
112 -
 113
113 -
 114
114 -
 115
115 -
 116
116 -
 117
117 -
 118
118 -
 119
119 -
 120
120 -
 121
121 -
 122
122 -
 123
123 -
 124
124 -
 125
125 -
 126
126 -
 127
127 -
128
-
129
-
130
-
131
-
132
-
133
-
134
-
135
-
136
-
137
-
138
-
139
-
140
-
141
-
142
-
143
-
144
-
145
-
146
-
147
-
148
-
149
-
150
-
151
-
152
-
153
-
154
-
155
-
156
-
157
-
158
-
159
-
160
-
161
-
162
-
163
-
164
-
165
-
166
-
167
-
168
-
169
-
170
-
171
-
172
-
173
-
174
-
175
-
176
-
177
-
178
-
179
-
180
-
181
-
182
-
183
-
184
-
185
-
186
-
187
-
188
-
189
-
190
-
191
-
192
-
193
-
194
-
195
-
196
-
197
-
198
-
199
-
200
-
201
-
202
-
203
-
204
-
205
-
206
-
207
-
208
-
209
-
210
-
211
-
212
-
213
-
214
-
215
-
216
-
217
-
218
-
219
-
220
-
221
-
222
-
223
-
224
-
225
-
226
-
227
 |
 |

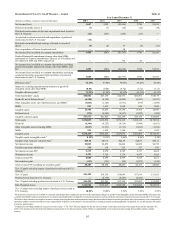
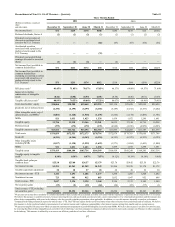
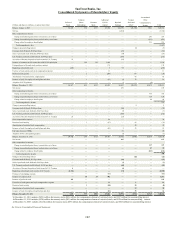
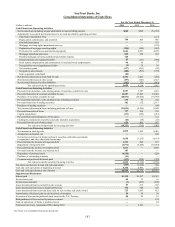
101
SunTrust Banks, Inc.
Consolidated Balance Sheets
(Dollars in millions and shares in thousands)
Assets
Cash and due from banks
Securities purchased under agreements to resell
Interest-bearing deposits in other banks
Cash and cash equivalents
Trading assets
Securities available for sale
Loans held for sale1 (loans at fair value: $2,141 and $3,168 as of December 31, 2011 and 2010, respectively)
Loans2 (loans at fair value: $433 and $492 as of December 31, 2011 and 2010, respectively)
Allowance for loan and lease losses
Net loans
Premises and equipment
Goodwill
Other intangible assets (MSRs at fair value: $921 and $1,439 as of December 31, 2011 and 2010, respectively)
Other real estate owned
Other assets
Total assets
Liabilities and Shareholders’ Equity
Noninterest-bearing consumer and commercial deposits
Interest-bearing consumer and commercial deposits
Total consumer and commercial deposits
Brokered time deposits (CDs at fair value: $1,018 and $1,213 as of December 31, 2011 and 2010, respectively)
Foreign deposits
Total deposits
Funds purchased
Securities sold under agreements to repurchase
Other short-term borrowings
Long-term debt 3 (debt at fair value: $1,997 and $2,837 as of December 31, 2011 and 2010, respectively)
Trading liabilities
Other liabilities
Total liabilities
Preferred stock, no par value
Common stock, $1.00 par value
Additional paid in capital
Retained earnings
Treasury stock, at cost, and other4
Accumulated other comprehensive income, net of tax
Total shareholders’ equity
Total liabilities and shareholders’ equity
Common shares outstanding
Common shares authorized
Preferred shares outstanding
Preferred shares authorized
Treasury shares of common stock
1 Includes loans held for sale, at fair value, of consolidated VIEs
2 Includes loans of consolidated VIEs
3 Includes debt of consolidated VIEs ($289 million and $290 million at fair value as of December 31, 2011 and 2010,
respectively)
4 Includes $107 million $129 million as of December 31, 2011 and 2010, respectively, related to noncontrolling interest held.
As of December 31
2011
$3,696
792
21
4,509
6,279
28,117
2,353
122,495
(2,457)
120,038
1,564
6,344
1,017
479
6,159
$176,859
$34,359
91,252
125,611
2,281
30
127,922
839
1,644
8,983
10,908
1,806
4,691
156,793
275
550
9,306
8,978
(792)
1,749
20,066
$176,859
536,967
750,000
3
50,000
12,954
$315
3,322
722
2010
$4,296
1,058
24
5,378
6,175
26,895
3,501
115,975
(2,974)
113,001
1,620
6,323
1,571
596
7,814
$172,874
$27,290
92,735
120,025
2,365
654
123,044
951
2,180
2,690
13,648
2,678
4,553
149,744
4,942
515
8,403
8,542
(888)
1,616
23,130
$172,874
500,436
750,000
50
50,000
14,231
$316
2,869
764
See Notes to Consolidated Financial Statements.