SunTrust 2011 Annual Report Download - page 119
Download and view the complete annual report
Please find page 119 of the 2011 SunTrust annual report below. You can navigate through the pages in the report by either clicking on the pages listed below, or by using the keyword search tool below to find specific information within the annual report.-
 1
1 -
2
-
3
-
4
-
5
-
6
-
7
-
8
-
9
-
10
-
11
-
12
-
13
-
14
-
15
-
16
-
17
-
18
-
19
-
20
-
21
-
22
-
23
-
24
-
25
-
26
-
27
-
28
-
29
-
30
-
31
-
32
-
33
-
34
-
35
-
36
-
37
-
38
-
39
-
40
-
41
-
42
-
43
-
44
-
45
-
46
-
47
-
48
-
49
-
50
-
51
-
52
-
53
-
54
-
55
-
56
-
57
-
58
-
59
-
60
-
61
-
62
-
63
-
64
-
65
-
66
-
67
-
68
-
69
-
70
-
71
-
72
-
73
-
74
-
75
-
76
-
77
-
78
-
79
-
80
-
81
-
82
-
83
-
84
-
85
-
86
-
87
-
88
-
89
-
90
-
91
-
92
-
93
-
94
-
95
-
96
-
97
-
98
-
99
-
100
-
101
-
102
-
103
-
104
-
105
-
106
-
107
-
108
-
 109
109 -
 110
110 -
 111
111 -
 112
112 -
 113
113 -
 114
114 -
 115
115 -
 116
116 -
 117
117 -
 118
118 -
 119
119 -
 120
120 -
 121
121 -
 122
122 -
 123
123 -
 124
124 -
 125
125 -
 126
126 -
 127
127 -
 128
128 -
 129
129 -
130
-
131
-
132
-
133
-
134
-
135
-
136
-
137
-
138
-
139
-
140
-
141
-
142
-
143
-
144
-
145
-
146
-
147
-
148
-
149
-
150
-
151
-
152
-
153
-
154
-
155
-
156
-
157
-
158
-
159
-
160
-
161
-
162
-
163
-
164
-
165
-
166
-
167
-
168
-
169
-
170
-
171
-
172
-
173
-
174
-
175
-
176
-
177
-
178
-
179
-
180
-
181
-
182
-
183
-
184
-
185
-
186
-
187
-
188
-
189
-
190
-
191
-
192
-
193
-
194
-
195
-
196
-
197
-
198
-
199
-
200
-
201
-
202
-
203
-
204
-
205
-
206
-
207
-
208
-
209
-
210
-
211
-
212
-
213
-
214
-
215
-
216
-
217
-
218
-
219
-
220
-
221
-
222
-
223
-
224
-
225
-
226
-
227
 |
 |

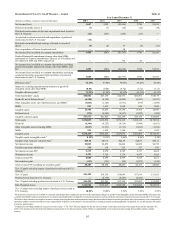
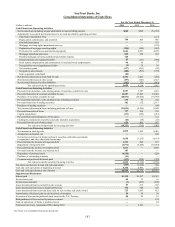
103
SunTrust Banks, Inc.
Consolidated Statements of Cash Flows
(Dollars in millions)
Cash Flows from Operating Activities
Net income/(loss) including income attributable to noncontrolling interest
Adjustments to reconcile net income/(loss) to net cash provided by operating activities:
Gain from ownership in Visa
Depreciation, amortization, and accretion
Goodwill impairment
Mortgage servicing rights impairment recovery
Origination of mortgage servicing rights
Provisions for credit losses and foreclosed property
Mortgage repurchase provision
Potential mortgage servicing settlement and claims expense
Deferred income tax expense/(benefit)
Stock option compensation and amortization of restricted stock compensation
Net (gain)/loss on extinguishment of debt
Net securities gains
Net gain on sale of assets
Gain on pension curtailment
Net decrease/(increase) in loans held for sale
Net (increase)/decrease in other assets
Net increase/(decrease) in other liabilities
Net cash provided by operating activities
Cash Flows from Investing Activities
Proceeds from maturities, calls, and paydowns of securities available for sale
Proceeds from sales of securities available for sale
Purchases of securities available for sale
Proceeds from maturities, calls, and paydowns of trading securities
Proceeds from sales of trading securities
Purchases of trading securities
Net (increase)/decrease in loans including purchases of loans
Proceeds from sales of loans
Capital expenditures
Proceeds from sale/redemption of Visa shares
Contingent consideration and other payments related to acquisitions
Proceeds from the sale of other assets
Net cash (used in)/provided by investing activities
Cash Flows from Financing Activities
Net increase in total deposits
Assumption of deposits, net
Net increase/(decrease) in funds purchased, securities sold under agreements
to repurchase, and other short-term borrowings
Proceeds from the issuance of long-term debt
Repayment of long-term debt
Proceeds from the issuance of common stock
Proceeds from the issuance of preferred stock
Repurchase of preferred stock
Purchase of outstanding warrants
Common and preferred dividends paid
Net cash provided by/(used in) financing activities
Net (decrease)/increase in cash and cash equivalents
Cash and cash equivalents at beginning of period
Cash and cash equivalents at end of period
Supplemental Disclosures:
Interest paid
Income taxes paid
Income taxes refunded
Loans transferred from loans held for sale to loans
Loans transferred from loans to loans held for sale
Loans transferred from loans and loans held for sale to other real estate owned
Amortization of deferred gain on sale/leaseback of premises
Accretion of discount for preferred stock issued to the U.S. Treasury
Extinguishment of forward stock purchase contract
Gain on repurchase of Series A preferred stock
Total assets of newly consolidated VIEs during 2010
For the Year Ended December 31
2011
$660
—
760
—
—
(224)
1,664
502
120
83
44
(3)
(117)
(408)
(88)
2,234
(497)
(102)
4,628
5,557
12,557
(18,872)
139
102
—
(11,034)
747
(131)
—
(24)
628
(10,331)
4,878
—
6,650
1,749
(4,571)
1,017
103
(4,850)
(11)
(131)
4,834
(869)
5,378
$4,509
$1,138
68
(1)
63
754
725
59
80
—
—
—
2010
$206
—
803
—
—
(289)
2,831
456
—
(171)
66
70
(191)
(597)
—
1,003
(341)
372
4,218
5,597
17,465
(20,920)
99
132
—
(4,566)
936
(252)
—
(10)
800
(719)
1,182
—
(1,295)
500
(5,246)
—
—
—
—
(259)
(5,118)
(1,619)
6,997
$5,378
$1,537
33
(435)
213
346
1,063
59
25
—
—
2,541
2009
($1,552)
(112)
966
751
(199)
(682)
4,270
444
—
(894)
77
39
(98)
(772)
—
(258)
1,523
(461)
3,042
3,407
19,488
(33,793)
148
2,113
(86)
8,609
756
(212)
112
(25)
567
1,084
8,085
449
(4,114)
575
(10,034)
1,830
—
(228)
—
(329)
(3,766)
360
6,637
$6,997
$2,367
45
(106)
307
125
812
59
23
174
94
—
See Notes to Consolidated Financial Statements.