SunTrust 2011 Annual Report Download - page 53
Download and view the complete annual report
Please find page 53 of the 2011 SunTrust annual report below. You can navigate through the pages in the report by either clicking on the pages listed below, or by using the keyword search tool below to find specific information within the annual report.-
 1
1 -
2
-
3
-
4
-
5
-
6
-
7
-
8
-
9
-
10
-
11
-
12
-
13
-
14
-
15
-
16
-
17
-
18
-
19
-
20
-
21
-
22
-
23
-
24
-
25
-
26
-
27
-
28
-
29
-
30
-
31
-
32
-
33
-
34
-
35
-
36
-
37
-
38
-
39
-
40
-
41
-
42
-
 43
43 -
 44
44 -
 45
45 -
 46
46 -
 47
47 -
 48
48 -
 49
49 -
 50
50 -
 51
51 -
 52
52 -
 53
53 -
 54
54 -
 55
55 -
 56
56 -
 57
57 -
 58
58 -
 59
59 -
 60
60 -
 61
61 -
 62
62 -
 63
63 -
64
-
65
-
66
-
67
-
68
-
69
-
70
-
71
-
72
-
73
-
74
-
75
-
76
-
77
-
78
-
79
-
80
-
81
-
82
-
83
-
84
-
85
-
86
-
87
-
88
-
89
-
90
-
91
-
92
-
93
-
94
-
95
-
96
-
97
-
98
-
99
-
100
-
101
-
102
-
103
-
104
-
105
-
106
-
107
-
108
-
109
-
110
-
111
-
112
-
113
-
114
-
115
-
116
-
117
-
118
-
119
-
120
-
121
-
122
-
123
-
124
-
125
-
126
-
127
-
128
-
129
-
130
-
131
-
132
-
133
-
134
-
135
-
136
-
137
-
138
-
139
-
140
-
141
-
142
-
143
-
144
-
145
-
146
-
147
-
148
-
149
-
150
-
151
-
152
-
153
-
154
-
155
-
156
-
157
-
158
-
159
-
160
-
161
-
162
-
163
-
164
-
165
-
166
-
167
-
168
-
169
-
170
-
171
-
172
-
173
-
174
-
175
-
176
-
177
-
178
-
179
-
180
-
181
-
182
-
183
-
184
-
185
-
186
-
187
-
188
-
189
-
190
-
191
-
192
-
193
-
194
-
195
-
196
-
197
-
198
-
199
-
200
-
201
-
202
-
203
-
204
-
205
-
206
-
207
-
208
-
209
-
210
-
211
-
212
-
213
-
214
-
215
-
216
-
217
-
218
-
219
-
220
-
221
-
222
-
223
-
224
-
225
-
226
-
227
 |
 |
37
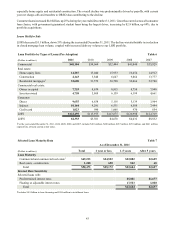
by declines of $1.7 billion, or 12%, in commercial real estate and by $1.3 billion, or 38%, in real estate construction, both
predominantly as a result of our targeted efforts to reduce exposure to these higher-risk loans, and by a $1.2 billion, or 25%,
decline in nonaccrual loans, primarily commercial nonaccrual loans, and a $0.6 billion, or 4%, decrease in real estate home
equity lines. Securities AFS also decreased by $1.3 billion, down 5%, predominantly due to the sale of lower yielding U.S.
Treasury securities of $4.4 billion, partially offset by purchases of agency MBS and federal agency securities. See additional
discussion in the “Securities Available for Sale” section in this MD&A for more information on the repositioning of our
securities AFS portfolio. LHFS declined by $1.0 billion, or 32%, as a result of a reduction in closed mortgage loan volume.
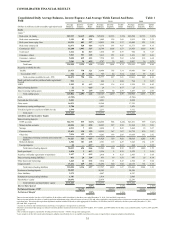
Our loan portfolio yielded 4.58% for the year, down 16 basis points from 2010. The yield decline was predominantly related
to higher balances in the consumer-indirect loan portfolio that included high-quality loans acquired at lower rates and the real
estate 1-4 family loan portfolio, which was driven by run-off of higher rate loans that we replaced with lower rate government
guaranteed loans. We utilize interest rate swaps to manage interest rate risk. The largest notional position of these swaps are
receive fixed/pay floating interest rate swaps that convert a portion of our commercial loan portfolio from floating rates, based
on LIBOR, to fixed rates. As of December 31, 2011, the outstanding notional balance of swaps was $14.9 billion, which
qualified as cash flow hedges on variable rate commercial loans, compared with $15.9 billion as of December 31, 2010. Swap
income remained relatively stable at $626 million during 2011 compared with $617 million during 2010. Reflected in our
swap income during 2011, was approximately $202 million of income related to terminated swaps. Beginning in the second
quarter of 2012, the income from certain swaps that were previously terminated will decline by approximately $35 million
per quarter. In the absence of additions or terminations, our notional balance of swaps will begin to mature in the second
quarter of 2013 with remaining maturities through early 2017. The average maturity of our swap notional balances at December
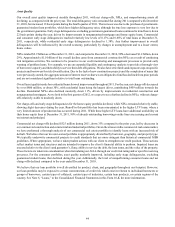
31, 2011 was 3.4 years. The U.S. government recently announced a plan that could potentially impact prepayments and
borrower payment caps related to a portion of our student loan portfolio. Some of our portfolio was acquired at a discount
and prepayments may result in additional net interest income; however, the impact of the plan is not expected to have a material
effect on our net interest income.
Average interest-bearing liabilities declined by $2.5 billion, or 2%, from 2010, predominantly as a result of a $4.0 billion, or
17%, decline in higher-cost time deposits and a $2.6 billion, or 16%, decline in long-term debt. The declines in time deposits
and long-term debt were partially offset by an increase in lower-cost client deposits, as compared to the same period during
2010. Total average consumer and commercial deposits increased by $5.5 billion, or 5%, compared with the same period
during 2010. This increase was predominantly driven by a $4.9 billion, or 19%, increase in demand deposits. The growth in
lower-cost deposits and the decline in time deposits and wholesale funding resulted in a 30 basis point decline in rates paid
on interest-bearing liabilities compared with the same period during 2010. The growth in lower-cost deposits was the result
of marketing campaigns, competitive pricing and clients’ increased preference for more liquid products.
During 2011, the interest rate environment was characterized by a flattening of the yield curve versus 2010, as rates at the
long end of the curve declined. More specifically, the Fed funds target rate averaged 0.25%, unchanged from last year. The
Prime rate averaged 3.25%, unchanged from 2010. During 2011, benchmark rates were as follows compared with 2010; one-
month LIBOR averaged 0.23%, a decrease of 4 basis points, three-month LIBOR averaged 0.34%, unchanged from 2010,
five-year swaps averaged 1.79%, a decrease of 37 basis points, and ten-year swaps averaged 2.90%, a decrease of 35 basis
points.
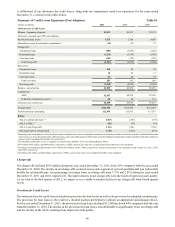
Foregone Interest
Foregone interest income from NPLs reduced net interest margin by 15 basis points during 2011, compared with 20 basis
points during 2010, as average nonaccrual loans decreased by $1.2 billion during the period ended December 31, 2011. See
additional discussion of our expectations for future levels of credit quality in the “Allowance for Credit Losses” and
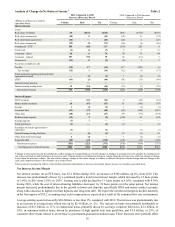
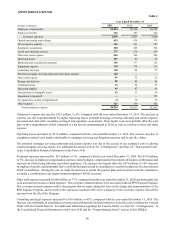
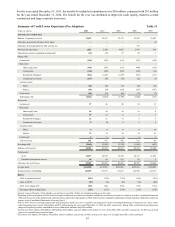
“Nonperforming Assets” sections of this MD&A. Tables 1 and 2 contain more detailed information concerning average
balances, yields earned, and rates paid.