SunTrust 2011 Annual Report Download - page 103
Download and view the complete annual report
Please find page 103 of the 2011 SunTrust annual report below. You can navigate through the pages in the report by either clicking on the pages listed below, or by using the keyword search tool below to find specific information within the annual report.-
 1
1 -
2
-
3
-
4
-
5
-
6
-
7
-
8
-
9
-
10
-
11
-
12
-
13
-
14
-
15
-
16
-
17
-
18
-
19
-
20
-
21
-
22
-
23
-
24
-
25
-
26
-
27
-
28
-
29
-
30
-
31
-
32
-
33
-
34
-
35
-
36
-
37
-
38
-
39
-
40
-
41
-
42
-
43
-
44
-
45
-
46
-
47
-
48
-
49
-
50
-
51
-
52
-
53
-
54
-
55
-
56
-
57
-
58
-
59
-
60
-
61
-
62
-
63
-
64
-
65
-
66
-
67
-
68
-
69
-
70
-
71
-
72
-
73
-
74
-
75
-
76
-
77
-
78
-
79
-
80
-
81
-
82
-
83
-
84
-
85
-
86
-
87
-
88
-
89
-
90
-
91
-
92
-
 93
93 -
 94
94 -
 95
95 -
 96
96 -
 97
97 -
 98
98 -
 99
99 -
 100
100 -
 101
101 -
 102
102 -
 103
103 -
 104
104 -
 105
105 -
 106
106 -
 107
107 -
 108
108 -
 109
109 -
 110
110 -
 111
111 -
 112
112 -
 113
113 -
114
-
115
-
116
-
117
-
118
-
119
-
120
-
121
-
122
-
123
-
124
-
125
-
126
-
127
-
128
-
129
-
130
-
131
-
132
-
133
-
134
-
135
-
136
-
137
-
138
-
139
-
140
-
141
-
142
-
143
-
144
-
145
-
146
-
147
-
148
-
149
-
150
-
151
-
152
-
153
-
154
-
155
-
156
-
157
-
158
-
159
-
160
-
161
-
162
-
163
-
164
-
165
-
166
-
167
-
168
-
169
-
170
-
171
-
172
-
173
-
174
-
175
-
176
-
177
-
178
-
179
-
180
-
181
-
182
-
183
-
184
-
185
-
186
-
187
-
188
-
189
-
190
-
191
-
192
-
193
-
194
-
195
-
196
-
197
-
198
-
199
-
200
-
201
-
202
-
203
-
204
-
205
-
206
-
207
-
208
-
209
-
210
-
211
-
212
-
213
-
214
-
215
-
216
-
217
-
218
-
219
-
220
-
221
-
222
-
223
-
224
-
225
-
226
-
227
 |
 |

87
declined due to a fourth quarter 2011 reduction in incentive expense based upon our full year financial performance. Other
noninterest expense increased by $53 million from the fourth quarter of 2010. This increase included a $27 million accrual in
other staff expense, which was related to severance expense associated with our PPG Expense Program, a $14 million increase in
consulting fees associated with the Consent Order, and a $7 million increase in mortgage insurance expense.
The income tax benefit for the fourth quarter of 2011 was $57 million, compared with the income tax provision of $45 million for
the fourth quarter of 2010. The decrease in the income tax provision was primarily the result of a decline in pre-tax income adjusted
for net favorable permanent tax items, such as interest income from lending to tax-exempt entities and federal tax credits from
community reinvestment activities in addition to favorable discrete items.
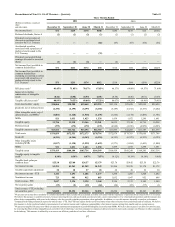
BUSINESS SEGMENTS
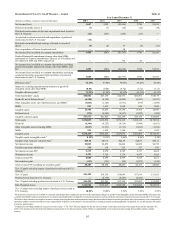
The following table presents net income/(loss) for our reportable business segments for the years ended December 31:
Net Income/(Loss) by Segment
(Dollars in millions)
Retail Banking
Diversified Commercial Banking
CRE
CIB
Mortgage
W&IM
Corporate Other and Treasury
2011
$193
269
(310)
355
(693)
160
447
2010
$73
203
(329)
320
(787)
138
489
Table 39
2009
($203)
157
(591)
117
(975)
100
381
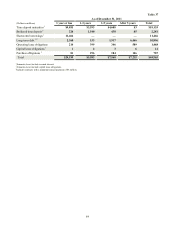
The following table presents average loans and average deposits for our reportable business segments for the years ended December
31:
Average Loans and Deposits by Segment
(Dollars in millions)
Retail Banking
Diversified Commercial Banking
CRE
CIB
Mortgage
W&IM
Corporate Other and Treasury
Average Loans
2011
$35,648
23,097
7,045
13,717
29,128
7,503
170
2010
$33,511
22,571
9,704
10,876
29,043
8,015
205
2009
$33,156
24,396
12,509
12,843
29,599
8,346
192
Average Consumer and Commercial Deposits
2011
$76,751
19,519
1,541
8,511
3,084
12,349
917
2010
$75,143
18,539
1,546
6,723
3,135
11,315
728
Table 40
2009
$72,751
17,652
1,885
5,855
3,134
11,185
702
See Note 21, “Business Segment Reporting,” to the Consolidated Financial Statements in this Form 10-K for discussion of our
segment structure, basis of presentation and internal management reporting methodologies.
BUSINESS SEGMENT RESULTS
Twelve Months Ended December 31, 2011 vs. 2010
Retail Banking
Retail Banking reported net income of $193 million for the twelve months ended December 31, 2011, an increase of $120 million,
compared with the same period in 2010. The increase in net income was predominantly due to lower provision for credit losses
and higher net interest income that was partially offset by lower noninterest income.
Net interest income was $2.5 billion, an increase of $43 million, or 2%, from the same period in 2010. The increase was driven
by the benefits derived from higher average loan balances and higher average deposit balances, partially offset by the impact of
lower deposit spreads. Average loan balances increased $2.1 billion, or 6%. Indirect installment loans increased $2.2 billion, driven
by organic indirect auto production and by the acquisition of $1.7 billion of consumer auto loans in the third and fourth quarters
of 2010. Additional consumer loan growth was the result of the purchase of $1.6 billion of guaranteed student loans during the