SunTrust 2011 Annual Report Download - page 111
Download and view the complete annual report
Please find page 111 of the 2011 SunTrust annual report below. You can navigate through the pages in the report by either clicking on the pages listed below, or by using the keyword search tool below to find specific information within the annual report.-
 1
1 -
2
-
3
-
4
-
5
-
6
-
7
-
8
-
9
-
10
-
11
-
12
-
13
-
14
-
15
-
16
-
17
-
18
-
19
-
20
-
21
-
22
-
23
-
24
-
25
-
26
-
27
-
28
-
29
-
30
-
31
-
32
-
33
-
34
-
35
-
36
-
37
-
38
-
39
-
40
-
41
-
42
-
43
-
44
-
45
-
46
-
47
-
48
-
49
-
50
-
51
-
52
-
53
-
54
-
55
-
56
-
57
-
58
-
59
-
60
-
61
-
62
-
63
-
64
-
65
-
66
-
67
-
68
-
69
-
70
-
71
-
72
-
73
-
74
-
75
-
76
-
77
-
78
-
79
-
80
-
81
-
82
-
83
-
84
-
85
-
86
-
87
-
88
-
89
-
90
-
91
-
92
-
93
-
94
-
95
-
96
-
97
-
98
-
99
-
100
-
 101
101 -
 102
102 -
 103
103 -
 104
104 -
 105
105 -
 106
106 -
 107
107 -
 108
108 -
 109
109 -
 110
110 -
 111
111 -
 112
112 -
 113
113 -
 114
114 -
 115
115 -
 116
116 -
 117
117 -
 118
118 -
 119
119 -
 120
120 -
 121
121 -
122
-
123
-
124
-
125
-
126
-
127
-
128
-
129
-
130
-
131
-
132
-
133
-
134
-
135
-
136
-
137
-
138
-
139
-
140
-
141
-
142
-
143
-
144
-
145
-
146
-
147
-
148
-
149
-
150
-
151
-
152
-
153
-
154
-
155
-
156
-
157
-
158
-
159
-
160
-
161
-
162
-
163
-
164
-
165
-
166
-
167
-
168
-
169
-
170
-
171
-
172
-
173
-
174
-
175
-
176
-
177
-
178
-
179
-
180
-
181
-
182
-
183
-
184
-
185
-
186
-
187
-
188
-
189
-
190
-
191
-
192
-
193
-
194
-
195
-
196
-
197
-
198
-
199
-
200
-
201
-
202
-
203
-
204
-
205
-
206
-
207
-
208
-
209
-
210
-
211
-
212
-
213
-
214
-
215
-
216
-
217
-
218
-
219
-
220
-
221
-
222
-
223
-
224
-
225
-
226
-
227
 |
 |
95
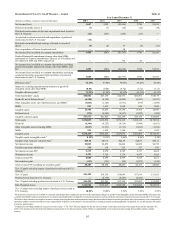
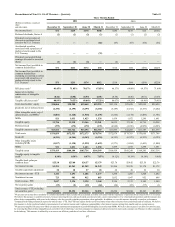
Reconcilement of Non-U.S. GAAP Measures – Annual
(Dollars in millions, except per share and other data)
Net income/(loss)
Preferred dividends, Series A
Dividends and accretion of discount on preferred stock issued to
the U.S. Treasury
Accelerated accretion associated with repurchase of preferred
stock issued to the U.S. Treasury
Dividends and undistributed earnings allocated to unvested
shares
Gain on purchase of Series A preferred stock
Net income/(loss) available to common shareholders
Goodwill/intangible impairment charges other than MSRs
attributable to common shareholders, after tax of $36 million and
$18 million in 2009 and 2008, respectively
Net income/(loss) available to common shareholders excluding
goodwill/intangible impairment charges other than MSRs, after
tax 1
Net income/(loss) available to common shareholders excluding
accelerated accretion associated with repurchase of preferred
stock issued to the U.S. Treasury 1
Efficiency ratio 2
Impact of excluding impairment/amortization of goodwill/
intangible assets other than MSRs
Tangible efficiency ratio 3
Total shareholders’ equity
Goodwill, net of deferred taxes 4
Other intangible assets, net of deferred taxes, and MSRs 5
MSRs
Tangible equity
Preferred stock
Tangible common equity
Total assets
Goodwill
Other intangible assets including MSRs
MSRs
Tangible assets
Tangible equity to tangible assets 6
Tangible book value per common share 7
Net interest income
Taxable-equivalent adjustment
Net interest income-FTE
Noninterest income
Total revenue-FTE
Net securities gains
Total revenue-FTE excluding net securities gains 8
Tier 1 Capital excluding impact of preferred stock issued to U.S.
Treasury 9
Tier 1 Capital
Preferred stock issued to U.S. Treasury
Tier 1 Capital excluding preferred stock issued to U.S. Treasury
Risk Weighted Assets
Tier 1 Capital ratio excluding impact of preferred stock issued to
U.S. Treasury
Year Ended December 31
2011
$647
(7)
(66)
(74)
(5)
—
$495
—
$495
$569
72.49%
(0.50)
71.99%
$20,066
(6,190)
(1,001)
921
13,796
(275)
$13,521
$176,859
(6,344)
(1,017)
921
$170,419
8.10%
$25.18
$5,065
114
5,179
3,421
8,600
(117)
$8,483
$14,490
—
$14,490
$132,940
10.90%
2010
$189
(7)
(267)
—
(2)
—
($87)
—
($87)
($87)
67.94%
(0.58)
67.36%
$23,130
(6,189)
(1,545)
1,439
16,835
(4,942)
$11,893
$172,874
(6,323)
(1,571)
1,439
$166,419
10.12%
$23.76
$4,854
116
4,970
3,729
8,699
(191)
$8,508
$18,156
(4,770)
$13,386
$132,819
10.08%
2009
($1,564)
(14)
(266)
—
17
94
($1,733)
715
($1,018)
($1,733)
79.07%
(9.72)
69.35%
$22,531
(6,204)
(1,671)
1,540
16,196
(4,917)
$11,279
$174,165
(6,319)
(1,711)
1,540
$167,675
9.66%
$22.59
$4,466
123
4,589
3,710
8,299
(98)
$8,201
$18,069
(4,745)
$13,324
$139,380
9.56%
2008
$796
(22)
(27)
—
(6)
—
$741
27
$768
$741
63.83%
(1.32)
62.51%
$22,501
(6,941)
(978)
810
15,392
(5,222)
$10,170
$189,138
(7,044)
(1,035)
810
$181,869
8.46%
$28.69
$4,620
117
4,737
4,473
9,210
(1,073)
$8,137
$17,614
(4,722)
$12,892
$162,046
7.96%
Table 41
2007
$1,634
(30)
—
—
(11)
—
$1,593
—
$1,593
$1,593
63.28%
(1.17)
62.11%
$18,170
(6,921)
(1,309)
1,049
10,989
(500)
$10,489
$179,574
(6,921)
(1,363)
1,049
$172,339
6.38%
$30.11
$4,720
102
4,822
3,429
8,251
(243)
$8,008
$11,425
—
$11,425
$164,932
6.93%
1We present net income/(loss) available to common shareholders that excludes the portion of the impairment charges on goodwill and intangible assets other than MSRs allocated to the
common shareholders and net income/(loss) to common shareholders that excludes the accelerated accretion associated with the repurchase of preferred stock issued to the U.S. Treasury.
We believe these measures are useful to investors, because removing the non-cash impairment charge and non-cash accelerated accretion provides a more representative view of normalized
operations and the measure also allows better comparability with peers in the industry who also provide a similar presentation when applicable. In addition, we use this measure internally
to analyze performance.
2Computed by dividing noninterest expense by total revenue - FTE. The FTE basis adjusts for the tax-favored status of net interest income from certain loans and investments. We
believe this measure to be the preferred industry measurement of net interest income and it enhances comparability of net interest income arising from taxable and tax-exempt
sources.