SunTrust 2011 Annual Report Download - page 48
Download and view the complete annual report
Please find page 48 of the 2011 SunTrust annual report below. You can navigate through the pages in the report by either clicking on the pages listed below, or by using the keyword search tool below to find specific information within the annual report.-
 1
1 -
2
-
3
-
4
-
5
-
6
-
7
-
8
-
9
-
10
-
11
-
12
-
13
-
14
-
15
-
16
-
17
-
18
-
19
-
20
-
21
-
22
-
23
-
24
-
25
-
26
-
27
-
28
-
29
-
30
-
31
-
32
-
33
-
34
-
35
-
36
-
37
-
 38
38 -
 39
39 -
 40
40 -
 41
41 -
 42
42 -
 43
43 -
 44
44 -
 45
45 -
 46
46 -
 47
47 -
 48
48 -
 49
49 -
 50
50 -
 51
51 -
 52
52 -
 53
53 -
 54
54 -
 55
55 -
 56
56 -
 57
57 -
 58
58 -
59
-
60
-
61
-
62
-
63
-
64
-
65
-
66
-
67
-
68
-
69
-
70
-
71
-
72
-
73
-
74
-
75
-
76
-
77
-
78
-
79
-
80
-
81
-
82
-
83
-
84
-
85
-
86
-
87
-
88
-
89
-
90
-
91
-
92
-
93
-
94
-
95
-
96
-
97
-
98
-
99
-
100
-
101
-
102
-
103
-
104
-
105
-
106
-
107
-
108
-
109
-
110
-
111
-
112
-
113
-
114
-
115
-
116
-
117
-
118
-
119
-
120
-
121
-
122
-
123
-
124
-
125
-
126
-
127
-
128
-
129
-
130
-
131
-
132
-
133
-
134
-
135
-
136
-
137
-
138
-
139
-
140
-
141
-
142
-
143
-
144
-
145
-
146
-
147
-
148
-
149
-
150
-
151
-
152
-
153
-
154
-
155
-
156
-
157
-
158
-
159
-
160
-
161
-
162
-
163
-
164
-
165
-
166
-
167
-
168
-
169
-
170
-
171
-
172
-
173
-
174
-
175
-
176
-
177
-
178
-
179
-
180
-
181
-
182
-
183
-
184
-
185
-
186
-
187
-
188
-
189
-
190
-
191
-
192
-
193
-
194
-
195
-
196
-
197
-
198
-
199
-
200
-
201
-
202
-
203
-
204
-
205
-
206
-
207
-
208
-
209
-
210
-
211
-
212
-
213
-
214
-
215
-
216
-
217
-
218
-
219
-
220
-
221
-
222
-
223
-
224
-
225
-
226
-
227
 |
 |
32
Federal Reserve now requires annual CCAR submissions and is currently reviewing our recent submission made on January
9, 2012.
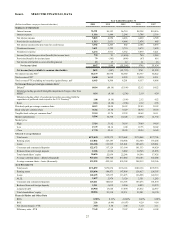
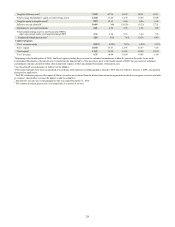
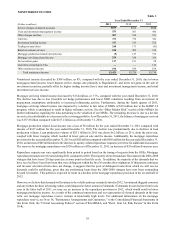
Our capital remained strong at December 31, 2011, and the level of common equity was significantly bolstered as a result of
the successful common equity raise in the first quarter of 2011, as well as retained earnings growth. Our Tier 1 common equity
ratio increased to 9.22% compared to 8.08% at December 31, 2010. Meanwhile, as a result of the change in our equity mix
due to the repurchase of the preferred stock issued to the U.S. Treasury and repurchase of approximately $400 million of trust
preferred securities during the year, as well as the impact of loan growth on RWA, our Tier 1 capital ratio declined to 10.90%,
compared to 13.67% at December 31, 2010. At December 31, 2010, our Tier 1 capital ratio, excluding preferred stock issued
to the U.S. Treasury, was 10.08%. Our total capital ratio at December 31, 2011 was 13.67% compared to 16.54% at
December 31, 2010. Overall, our capital remains strong and well above the requirements to be considered “well capitalized”
according to current and proposed regulatory standards.
Consistent with our desire to take actions that will positively benefit our shareholders, we made decisions during the year that
increased the return of capital to our shareholders. First, our Board approved an increase in the quarterly common stock
dividend to $0.05 per share for the third and fourth quarters. Second, when the U.S. Treasury auctioned our common stock
warrants in October, we repurchased and retired approximately 4 million of the 17.9 million common stock warrants auctioned.
Looking ahead, upon completion of the Federal Reserve's CCAR process in early 2012, we will evaluate additional actions
to further increase the return of capital to shareholders in 2012. See additional discussion of our liquidity and capital position
in the “Liquidity Risk” and “Capital Resources” sections of this MD&A.
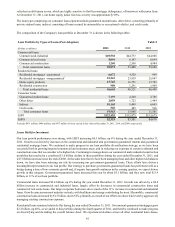
Financial performance
While 2011 presented a challenging operating environment, we ended the year with significantly better momentum than when
it started and achieved several milestones in our transformation to operate more efficiently and effectively in the new
environment. During 2011, EPS increased meaningfully, we paid back the U.S. government's TARP investment, low-cost
deposits were at record highs, we continued to change the risk composition of our loan portfolio in favor of lower risk loans
while growing total loans, credit quality steadily improved during the year, capital ratios remained strong, and we launched
an all-encompassing review of our operating expenses with a goal of eliminating $300 million in annual expenses by the end
of 2013. These efforts, coupled with our continued focus on serving our clients and managing our core business to drive
improved bottom line results, as well as improved credit quality, resulted in significant improvement of earnings during 2011.
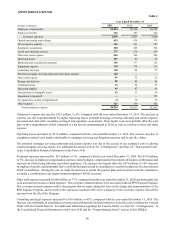
Net income available to common shareholders during the year of $495 million, or $0.94 per average common diluted share,
compares favorably to a net loss available to common shareholders of $87 million, or ($0.18) per average common diluted
share during 2010 and a net loss available to common shareholders of $1.7 billion, or ($3.98) per average common diluted
share during 2009. Results in 2011 were driven by lower provision for credit losses, higher net interest income, and the
reduction of preferred dividends paid to the U.S. Treasury after repayment of the U.S. government's TARP investment in
March. Results during 2010 and 2009 were driven by higher provision for credit losses, higher interest expense, and the
payment of preferred dividends to the U.S. Treasury. During the years ended December 31, 2011 and 2010, improved credit
quality resulted in the decrease of 43% and 35% in our provision for credit losses compared to the years ended December 31,
2010 and 2009, respectively, which was a significant driver of the increase in our net income/(loss) available to common
shareholders. As credit quality continues to improve, the impact to net income available to common shareholders due to lower
provisions for credit losses is expected to be less substantial in future periods.
Our results have improved and progress is being made for further improvement, but our performance is not where we would
like for it to be, and therefore we announced specific initiatives during 2011 that are aimed at improving our performance in
the future. Our PPG is the collection of initiatives across the organization that we believe will improve efficiency and, over
time will be a key component in our plan to reduce our efficiency ratio to targeted levels below 60%, as will the expected
normalization in credit-related expense and mortgage repurchase provision as the economic environment improves. The three
main components of the PPG expense program are focused in the areas of strategic supply management, consumer bank
efficiencies, and operations staff and support. We have made significant progress in our planning for PPG, and implementation
is underway on many of its initiatives that should result in $300 million in annual expense savings, with the majority of the
actions to be accomplished during 2012 and the remainder in 2013. At the end of 2011, $75 million in annualized savings
had been realized with a majority coming from the strategic supply management area as a result of actions taken related to
vendor costs, demand management, and discretionary spending. Initiatives in the consumer bank area and operations support
and staff also contributed to the savings realized in 2011, primarily due to refining the branch network and staffing models
and through consolidations and shared services related to certain operational staff and support teams. By the end of 2012,
we anticipate realization of at least $240 million in annualized savings through our PPG expense program, with the remainder
realized by December 2013.
Our asset quality metrics improved again this year, with improvements in the provision for credit losses, net charge-offs,
NPLs, nonperforming assets, and early stage delinquencies. At December 31, 2011, the ALLL ratio remains elevated by