SunTrust 2011 Annual Report Download - page 113
Download and view the complete annual report
Please find page 113 of the 2011 SunTrust annual report below. You can navigate through the pages in the report by either clicking on the pages listed below, or by using the keyword search tool below to find specific information within the annual report.-
 1
1 -
2
-
3
-
4
-
5
-
6
-
7
-
8
-
9
-
10
-
11
-
12
-
13
-
14
-
15
-
16
-
17
-
18
-
19
-
20
-
21
-
22
-
23
-
24
-
25
-
26
-
27
-
28
-
29
-
30
-
31
-
32
-
33
-
34
-
35
-
36
-
37
-
38
-
39
-
40
-
41
-
42
-
43
-
44
-
45
-
46
-
47
-
48
-
49
-
50
-
51
-
52
-
53
-
54
-
55
-
56
-
57
-
58
-
59
-
60
-
61
-
62
-
63
-
64
-
65
-
66
-
67
-
68
-
69
-
70
-
71
-
72
-
73
-
74
-
75
-
76
-
77
-
78
-
79
-
80
-
81
-
82
-
83
-
84
-
85
-
86
-
87
-
88
-
89
-
90
-
91
-
92
-
93
-
94
-
95
-
96
-
97
-
98
-
99
-
100
-
101
-
102
-
 103
103 -
 104
104 -
 105
105 -
 106
106 -
 107
107 -
 108
108 -
 109
109 -
 110
110 -
 111
111 -
 112
112 -
 113
113 -
 114
114 -
 115
115 -
 116
116 -
 117
117 -
 118
118 -
 119
119 -
 120
120 -
 121
121 -
 122
122 -
 123
123 -
124
-
125
-
126
-
127
-
128
-
129
-
130
-
131
-
132
-
133
-
134
-
135
-
136
-
137
-
138
-
139
-
140
-
141
-
142
-
143
-
144
-
145
-
146
-
147
-
148
-
149
-
150
-
151
-
152
-
153
-
154
-
155
-
156
-
157
-
158
-
159
-
160
-
161
-
162
-
163
-
164
-
165
-
166
-
167
-
168
-
169
-
170
-
171
-
172
-
173
-
174
-
175
-
176
-
177
-
178
-
179
-
180
-
181
-
182
-
183
-
184
-
185
-
186
-
187
-
188
-
189
-
190
-
191
-
192
-
193
-
194
-
195
-
196
-
197
-
198
-
199
-
200
-
201
-
202
-
203
-
204
-
205
-
206
-
207
-
208
-
209
-
210
-
211
-
212
-
213
-
214
-
215
-
216
-
217
-
218
-
219
-
220
-
221
-
222
-
223
-
224
-
225
-
226
-
227
 |
 |

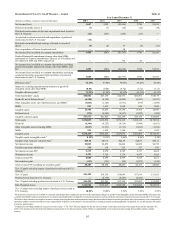
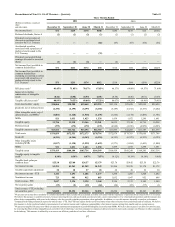
97
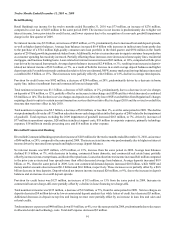
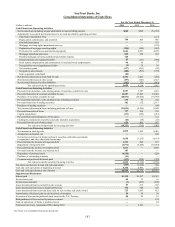
Reconcilement of Non-U.S. GAAP Measures – Quarterly
(Dollars in millions, except per
share
and other data)
Net income/(loss)
Preferred dividends, Series A
Dividends and accretion of
discount on preferred stock
issued to the U.S. Treasury
Accelerated accretion
associated with repurchase of
preferred stock issued to the
U.S. Treasury
Dividends and undistributed
earnings allocated to unvested
shares
Net income/(loss) available to
common shareholders
Net income/(loss) available to
common shareholders
excluding accelerated accretion
associated with repurchase of
preferred stock issued to the
U.S. Treasury 1
Efficiency ratio 2
Impact of excluding
amortization of intangible
assets
Tangible efficiency ratio 3
Total shareholders’ equity
Goodwill, net of deferred taxes
4
Other intangible assets, net of
deferred taxes, and MSRs 5
MSRs
Tangible equity
Preferred stock
Tangible common equity
Total assets
Goodwill
Other intangible assets
including MSRs
MSRs
Tangible assets
Tangible equity to tangible
assets 6
Tangible book value per
common share 7
Net interest income
Taxable-equivalent adjustment
Net interest income - FTE
Noninterest income
Total revenue - FTE
Net securities gains
Total revenue - FTE excluding
net securities gains 8
Three Months Ended
2011
December 31
$74
(2)
—
—
(1)
$71
$71
81.45%
(0.46)
80.99%
$20,066
(6,190)
(1,001)
921
13,796
(275)
$13,521
$176,859
(6,344)
(1,017)
921
$170,419
8.10%
$25.18
$1,294
30
1,324
723
2,047
(19)
$2,028
September 30
$215
(2)
—
—
(2)
$211
$211
71.05%
(0.50)
70.55%
$20,200
(6,195)
(1,120)
1,033
13,918
(172)
$13,746
$172,553
(6,344)
(1,138)
1,033
$166,104
8.38%
$25.60
$1,263
30
1,293
903
2,196
(2)
$2,194
June 30
$178
(2)
—
—
(2)
$174
$174
70.17%
(0.53)
69.64%
$19,660
(6,199)
(1,518)
1,423
13,366
(172)
$13,194
$172,173
(6,343)
(1,539)
1,423
$165,714
8.07%
$24.57
$1,259
27
1,286
912
2,198
(32)
$2,166
March 31
$180
(2)
(66)
(74)
—
$38
$112
67.83%
(0.51)
67.32%
$19,223
(6,185)
(1,635)
1,538
12,941
(172)
$12,769
$170,794
(6,324)
(1,659)
1,538
$164,349
7.87%
$23.79
$1,249
28
1,277
883
2,160
(64)
$2,096
2010
December 31
$185
(2)
(67)
—
(2)
$114
$114
66.57%
(0.50)
66.07%
$23,130
(6,189)
(1,545)
1,439
16,835
(4,942)
$11,893
$172,874
(6,323)
(1,571)
1,439
$166,419
10.12%
$23.76
$1,266
28
1,294
1,032
2,326
(64)
$2,262
September 30
$153
(2)
(67)
—
—
$84
$84
64.80%
(0.56)
64.24%
$23,438
(6,192)
(1,174)
1,072
17,144
(4,936)
$12,208
$174,703
(6,323)
(1,204)
1,072
$168,248
10.19%
$24.42
$1,238
28
1,266
1,047
2,313
(69)
$2,244
June 30
$12
(2)
(66)
—
—
($56)
($56)
69.57%
(0.61)
68.96%
$23,024
(6,197)
(1,409)
1,298
16,716
(4,929)
$11,787
$170,668
(6,323)
(1,443)
1,298
$164,200
10.18%
$23.58
$1,178
30
1,208
952
2,160
(57)
$2,103
Table 42
March 31
($161)
(2)
(66)
—
—
($229)
($229)
71.60%
(0.69)
70.91%
$22,620
(6,202)
(1,761)
1,641
16,298
(4,923)
$11,375
$171,796
(6,323)
(1,800)
1,641
$165,314
9.86%
$22.76
$1,172
30
1,202
698
1,900
(1)
$1,899
1We present net income/(loss) available to common shareholders that excludes the accelerated accretion associated with the repurchase of preferred stock issued to the U.S. Treasury.
We believe this measure is useful to investors, because removing the non-cash accelerated accretion provides a more representative view of normalized operations and the measure also
allows better comparability with peers in the industry who also provide a similar presentation when applicable. In addition, we use this measure internally to analyze performance.
2Computed by dividing noninterest expense by total revenue - FTE. The FTE basis adjusts for the tax-favored status of net interest income from certain loans and investments. We believe
this measure to be the preferred industry measurement of net interest income and it enhances comparability of net interest income arising from taxable and tax-exempt sources.
3We present a tangible efficiency ratio which excludes the amortization/impairment of goodwill/intangible assets other than MSRs. We believe this measure is useful to investors because,
by removing the effect of these intangible asset costs (the level of which may vary from company to company), it allows investors to more easily compare our efficiency to other companies
in the industry. This measure is utilized by us to assess our efficiency and that of our lines of business.