SunTrust 2011 Annual Report Download - page 211
Download and view the complete annual report
Please find page 211 of the 2011 SunTrust annual report below. You can navigate through the pages in the report by either clicking on the pages listed below, or by using the keyword search tool below to find specific information within the annual report.-
 1
1 -
2
-
3
-
4
-
5
-
6
-
7
-
8
-
9
-
10
-
11
-
12
-
13
-
14
-
15
-
16
-
17
-
18
-
19
-
20
-
21
-
22
-
23
-
24
-
25
-
26
-
27
-
28
-
29
-
30
-
31
-
32
-
33
-
34
-
35
-
36
-
37
-
38
-
39
-
40
-
41
-
42
-
43
-
44
-
45
-
46
-
47
-
48
-
49
-
50
-
51
-
52
-
53
-
54
-
55
-
56
-
57
-
58
-
59
-
60
-
61
-
62
-
63
-
64
-
65
-
66
-
67
-
68
-
69
-
70
-
71
-
72
-
73
-
74
-
75
-
76
-
77
-
78
-
79
-
80
-
81
-
82
-
83
-
84
-
85
-
86
-
87
-
88
-
89
-
90
-
91
-
92
-
93
-
94
-
95
-
96
-
97
-
98
-
99
-
100
-
101
-
102
-
103
-
104
-
105
-
106
-
107
-
108
-
109
-
110
-
111
-
112
-
113
-
114
-
115
-
116
-
117
-
118
-
119
-
120
-
121
-
122
-
123
-
124
-
125
-
126
-
127
-
128
-
129
-
130
-
131
-
132
-
133
-
134
-
135
-
136
-
137
-
138
-
139
-
140
-
141
-
142
-
143
-
144
-
145
-
146
-
147
-
148
-
149
-
150
-
151
-
152
-
153
-
154
-
155
-
156
-
157
-
158
-
159
-
160
-
161
-
162
-
163
-
164
-
165
-
166
-
167
-
168
-
169
-
170
-
171
-
172
-
173
-
174
-
175
-
176
-
177
-
178
-
179
-
180
-
181
-
182
-
183
-
184
-
185
-
186
-
187
-
188
-
189
-
190
-
191
-
192
-
193
-
194
-
195
-
196
-
197
-
198
-
199
-
200
-
 201
201 -
 202
202 -
 203
203 -
 204
204 -
 205
205 -
 206
206 -
 207
207 -
 208
208 -
 209
209 -
 210
210 -
 211
211 -
 212
212 -
 213
213 -
 214
214 -
 215
215 -
 216
216 -
 217
217 -
 218
218 -
 219
219 -
 220
220 -
 221
221 -
222
-
223
-
224
-
225
-
226
-
227
 |
 |
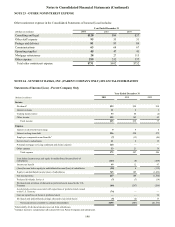
Notes to Consolidated Financial Statements (Continued)
195
• Support and Overhead Costs – Expenses not directly attributable to a specific segment are allocated based on various
drivers (e.g., number of full-time equivalent employees and volume of loans and deposits). The recoveries for these
allocations are in Corporate Other and Treasury.
• Sales and Referral Credits – Segments may compensate another segment for referring or selling certain products.
The majority of the revenue resides in the segment where the product is ultimately managed.
The application and development of management reporting methodologies is a dynamic process and is subject to periodic
enhancements. The implementation of these enhancements to the internal management reporting methodology may materially
affect the results disclosed for each segment with no impact on consolidated results. Whenever significant changes to management
reporting methodologies take place, the impact of these changes is quantified and prior period information is reclassified wherever
practicable.
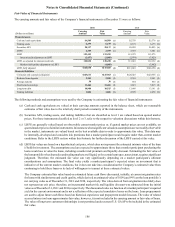
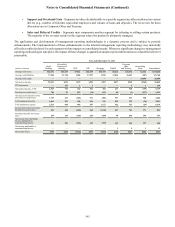
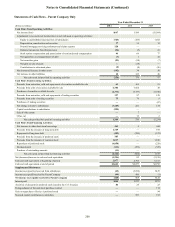
(Dollars in millions)
Average total assets
Average total liabilities
Average total equity
Net interest income
FTE adjustment
Net interest income - FTE 1
Provision for credit losses 2
Net interest income/(loss) after
provision for credit losses
Total noninterest income
Total noninterest expense
Income/(loss) before provision/
(benefit) for income taxes
Provision/(benefit) for income
taxes 3
Net income/(loss) including
income attributable to
noncontrolling interest
Net income attributable to
noncontrolling interest
Net income/(loss)
Year ended December 31, 2011
Retail
Banking
$41,071
77,458
—
$2,543
—
2,543
784
1,759
1,064
2,521
302
109
193
—
$193
Diversified
Commercial
Banking
$25,237
21,740
—
$622
103
725
92
633
251
460
424
155
269
—
$269
CRE
$7,961
1,568
—
$139
1
140
422
(282)
100
448
(630)
(320)
(310)
—
($310)
CIB
$22,959
17,879
—
$498
3
501
(10)
511
636
587
560
205
355
—
$355
Mortgage
$33,719
3,838
—
$492
—
492
693
(201)
241
1,172
(1,132)
(439)
(693)
—
($693)
W&IM
$8,616
13,036
—
$417
—
417
60
357
822
922
257
94
163
3
$160
Corporate
Other
and Treasury
$31,576
16,432
—
$514
6
520
(1)
521
333
153
701
245
456
9
$447
Reconciling
Items
$1,301
(207)
20,696
($160)
1
(159)
(527)
368
(26)
(29)
371
144
227
1
$226
Consolidated
$172,440
151,744
20,696
$5,065
114
5,179
1,513
3,666
3,421
6,234
853
193
660
13
$647