SunTrust 2011 Annual Report Download - page 147
Download and view the complete annual report
Please find page 147 of the 2011 SunTrust annual report below. You can navigate through the pages in the report by either clicking on the pages listed below, or by using the keyword search tool below to find specific information within the annual report.-
 1
1 -
2
-
3
-
4
-
5
-
6
-
7
-
8
-
9
-
10
-
11
-
12
-
13
-
14
-
15
-
16
-
17
-
18
-
19
-
20
-
21
-
22
-
23
-
24
-
25
-
26
-
27
-
28
-
29
-
30
-
31
-
32
-
33
-
34
-
35
-
36
-
37
-
38
-
39
-
40
-
41
-
42
-
43
-
44
-
45
-
46
-
47
-
48
-
49
-
50
-
51
-
52
-
53
-
54
-
55
-
56
-
57
-
58
-
59
-
60
-
61
-
62
-
63
-
64
-
65
-
66
-
67
-
68
-
69
-
70
-
71
-
72
-
73
-
74
-
75
-
76
-
77
-
78
-
79
-
80
-
81
-
82
-
83
-
84
-
85
-
86
-
87
-
88
-
89
-
90
-
91
-
92
-
93
-
94
-
95
-
96
-
97
-
98
-
99
-
100
-
101
-
102
-
103
-
104
-
105
-
106
-
107
-
108
-
109
-
110
-
111
-
112
-
113
-
114
-
115
-
116
-
117
-
118
-
119
-
120
-
121
-
122
-
123
-
124
-
125
-
126
-
127
-
128
-
129
-
130
-
131
-
132
-
133
-
134
-
135
-
136
-
 137
137 -
 138
138 -
 139
139 -
 140
140 -
 141
141 -
 142
142 -
 143
143 -
 144
144 -
 145
145 -
 146
146 -
 147
147 -
 148
148 -
 149
149 -
 150
150 -
 151
151 -
 152
152 -
 153
153 -
 154
154 -
 155
155 -
 156
156 -
 157
157 -
158
-
159
-
160
-
161
-
162
-
163
-
164
-
165
-
166
-
167
-
168
-
169
-
170
-
171
-
172
-
173
-
174
-
175
-
176
-
177
-
178
-
179
-
180
-
181
-
182
-
183
-
184
-
185
-
186
-
187
-
188
-
189
-
190
-
191
-
192
-
193
-
194
-
195
-
196
-
197
-
198
-
199
-
200
-
201
-
202
-
203
-
204
-
205
-
206
-
207
-
208
-
209
-
210
-
211
-
212
-
213
-
214
-
215
-
216
-
217
-
218
-
219
-
220
-
221
-
222
-
223
-
224
-
225
-
226
-
227
 |
 |

Notes to Consolidated Financial Statements (Continued)
131
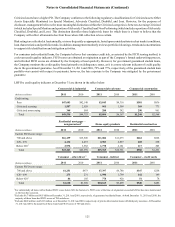
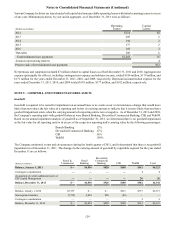
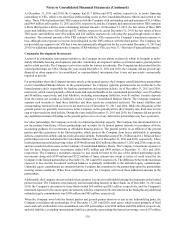
As of December 31, 2011, 2010, and 2009, the total unpaid principal balance of mortgage loans serviced was $157.8 billion,
$167.2 billion, and $178.9 billion, respectively. Included in these amounts were $124.1 billion, $134.1 billion, and $146.7 billion
as of December 31, 2011, 2010, and 2009, respectively, of loans serviced for third parties. During the year ended December 31,
2011, the Company sold MSRs on residential loans with an unpaid principal balance of $2.3 billion. Because MSRs are reported
at fair value, the sale did not have a material impact on mortgage servicing related income.
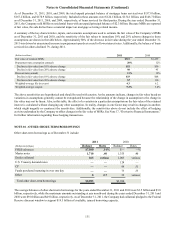
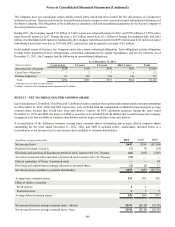
A summary of the key characteristics, inputs, and economic assumptions used to estimate the fair value of the Company’s MSRs
as of December 31, 2011 and 2010, and the sensitivity of the fair values to immediate 10% and 20% adverse changes in those
assumptions are shown in the table below. Approximately 80% of the decrease in fair value during the year ended December 31,
2011 was driven by an assumed increase in prepayment speeds as a result of lower interest rates. Additionally, the balance of loans
serviced for others declined 7% during 2011.
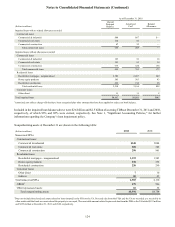
(Dollars in millions)
Fair value of retained MSRs
Prepayment rate assumption (annual)
Decline in fair value from 10% adverse change
Decline in fair value from 20% adverse change
Discount rate (annual)
Decline in fair value from 10% adverse change
Decline in fair value from 20% adverse change
Weighted-average life (in years)
Weighted-average coupon
2011
$921
20%
$52
98
11%
$33
63
4.3
5.2%
2010
$1,439
12%
$50
95
12%
$68
130
6.2
5.4%
The above sensitivities are hypothetical and should be used with caution. As the amounts indicate, changes in fair value based on
variations in assumptions generally cannot be extrapolated because the relationship of the change in assumption to the change in
fair value may not be linear. Also, in this table, the effect of a variation in a particular assumption on the fair value of the retained
interest is calculated without changing any other assumption. In reality, changes in one factor may result in changes in another,
which might magnify or counteract the sensitivities. Additionally, the sensitivities above do not include the effect of hedging
activity undertaken by the Company to offset changes in the fair value of MSRs. See Note 17, “Derivative Financial Instruments,”
for further information regarding these hedging transactions.
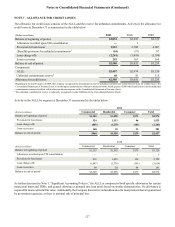
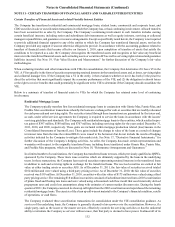
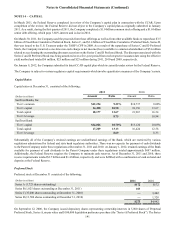
NOTE 10 - OTHER SHORT-TERM BORROWINGS
Other short-term borrowings as of December 31 include:
(Dollars in millions)
FHLB advances
Master notes
Dealer collateral
U.S. Treasury demand notes
CP
Funds purchased maturing in over one day
Other
Total other short-term borrowings
2011
Balance
$7,000
1,710
265
—
—
—
8
$8,983
Rates
.14%
.40
various
—
—
—
2.7
2010
Balance
$—
1,355
1,005
124
99
75
32
$2,690
Rates
—%
.40
various
—
.51
.35
various
The average balances of other short-term borrowings for the years ended December 31, 2011 and 2010 were $3.5 billion and $3.0
billion, respectively, while the maximum amounts outstanding at any month-end during the years ended December 31, 2011 and
2010 were $9.0 billion and $4.9 billion, respectively. As of December 31, 2011, the Company had collateral pledged to the Federal
Reserve discount window to support $19.5 billion of available, unused borrowing capacity.