SunTrust 2011 Annual Report Download - page 163
Download and view the complete annual report
Please find page 163 of the 2011 SunTrust annual report below. You can navigate through the pages in the report by either clicking on the pages listed below, or by using the keyword search tool below to find specific information within the annual report.-
 1
1 -
2
-
3
-
4
-
5
-
6
-
7
-
8
-
9
-
10
-
11
-
12
-
13
-
14
-
15
-
16
-
17
-
18
-
19
-
20
-
21
-
22
-
23
-
24
-
25
-
26
-
27
-
28
-
29
-
30
-
31
-
32
-
33
-
34
-
35
-
36
-
37
-
38
-
39
-
40
-
41
-
42
-
43
-
44
-
45
-
46
-
47
-
48
-
49
-
50
-
51
-
52
-
53
-
54
-
55
-
56
-
57
-
58
-
59
-
60
-
61
-
62
-
63
-
64
-
65
-
66
-
67
-
68
-
69
-
70
-
71
-
72
-
73
-
74
-
75
-
76
-
77
-
78
-
79
-
80
-
81
-
82
-
83
-
84
-
85
-
86
-
87
-
88
-
89
-
90
-
91
-
92
-
93
-
94
-
95
-
96
-
97
-
98
-
99
-
100
-
101
-
102
-
103
-
104
-
105
-
106
-
107
-
108
-
109
-
110
-
111
-
112
-
113
-
114
-
115
-
116
-
117
-
118
-
119
-
120
-
121
-
122
-
123
-
124
-
125
-
126
-
127
-
128
-
129
-
130
-
131
-
132
-
133
-
134
-
135
-
136
-
137
-
138
-
139
-
140
-
141
-
142
-
143
-
144
-
145
-
146
-
147
-
148
-
149
-
150
-
151
-
152
-
 153
153 -
 154
154 -
 155
155 -
 156
156 -
 157
157 -
 158
158 -
 159
159 -
 160
160 -
 161
161 -
 162
162 -
 163
163 -
 164
164 -
 165
165 -
 166
166 -
 167
167 -
 168
168 -
 169
169 -
 170
170 -
 171
171 -
 172
172 -
 173
173 -
174
-
175
-
176
-
177
-
178
-
179
-
180
-
181
-
182
-
183
-
184
-
185
-
186
-
187
-
188
-
189
-
190
-
191
-
192
-
193
-
194
-
195
-
196
-
197
-
198
-
199
-
200
-
201
-
202
-
203
-
204
-
205
-
206
-
207
-
208
-
209
-
210
-
211
-
212
-
213
-
214
-
215
-
216
-
217
-
218
-
219
-
220
-
221
-
222
-
223
-
224
-
225
-
226
-
227
 |
 |
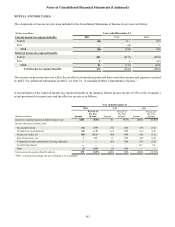
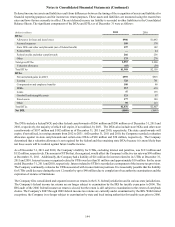
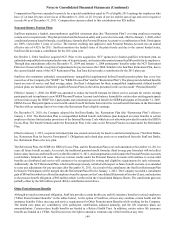
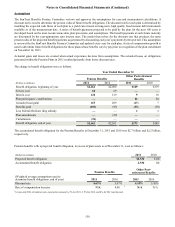
Notes to Consolidated Financial Statements (Continued)
147
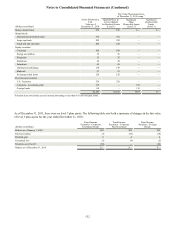
The following table presents a summary of stock option and restricted stock activity:
(Dollars in millions,
except per share
data)
Balance, January 1,
2009
Granted
Exercised/vested
Cancelled/expired/
forfeited
Amortization of
restricted stock
compensation
Balance, December
31, 2009
Granted
Exercised/vested
Cancelled/expired/
forfeited
Amortization of
restricted stock
compensation
Balance, December
31, 2010
Granted
Exercised/vested
Cancelled/expired/
forfeited
Amortization of
restricted stock
compensation
Balance, December
31, 2011
Exercisable,
December 31, 2011
Available for
Additional Grant,
December 31, 20111
Stock Options
Shares
15,641,872
3,803,796
—
(1,784,452)
—
17,661,216
1,192,974
—
(1,711,690)
—
17,142,500
813,265
(20,000)
(2,066,348)
—
15,869,417
10,294,719
20,355,430
Price
Range
$17.06-$150.45
9.06
—
9.06 - 149.81
—
9.06 - 150.45
22.69 - 27.79
—
9.06 - 140.14
—
9.06 - 150.45
19.98 - 32.27
9.06
9.06 - 140.40
—
$9.06-$150.45
Weighted
Average
Exercise
Price
$65.29
9.06
—
65.39
—
53.17
23.64
—
52.62
—
51.17
29.70
9.06
63.40
—
$48.53
$66.20
Restricted Stock
Shares
3,803,412
2,565,648
(1,255,092)
(343,796)
—
4,770,172
1,355,075
(1,266,267)
(238,171)
—
4,620,809
1,400,305
(1,085,252)
(313,695)
—
4,622,167
Deferred
Compensation
Grant Price
$113
28
—
(16)
(66)
59
33
—
(7)
(42)
43
44
—
(7)
(32)
$48
Weighted
Average
Grant
Price
$64.61
10.40
64.79
46.59
—
37.02
24.01
67.27
29.22
—
25.32
31.27
50.37
22.07
—
$21.46
Restricted Stock Units
Shares
—
66,420
—
—
—
66,420
—
—
(1,230)
—
65,190
344,590
—
(4,305)
—
405,475
Price
Range
$—
26.96
—
—
—
26.96
—
—
26.96
—
26.96
27.50 - 42.10
—
26.96
—
$26.96-$42.10
Weighted
Average
Grant
Price
$—
26.96
—
—
—
26.96
—
—
26.96
—
26.96
37.57
—
26.96
—
$35.98
1 Includes 13,759,670 shares available to be issued as restricted stock.
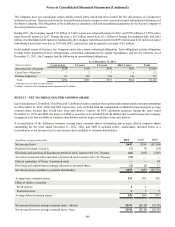
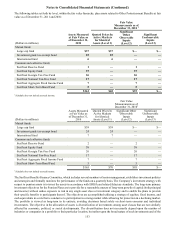
The following table presents information on stock options by ranges of exercise price at December 31, 2011:
(Dollars in millions, except per share data)
Range of Exercise
Prices
$9.06 to 49.46
$49.47 to 64.57
$64.58 to 150.45
Options Outstanding
Number
Outstanding
as of
December
31, 2011
6,109,094
2,559,551
7,200,772
15,869,417
Weighted
Average
Exercise
Price
$17.47
54.73
72.67
$48.53
Weighted
Average
Remaining
Contractual
Life (Years)
6.98
1.10
3.10
4.27
Total
Aggregate
Intrinsic
Value
$31
—
—
$31
Options Exercisable
Number
Exercisable
as of
December
31, 2011
534,396
2,559,551
7,200,772
10,294,719
Weighted
Average
Exercise
Price
$33.95
54.73
72.67
$66.20
Weighted
Average
Remaining
Contractual
Life (Years)
1.54
1.10
3.10
2.52
Total
Aggregate
Intrinsic
Value
$2
—
—
$2