SunTrust 2011 Annual Report Download - page 109
Download and view the complete annual report
Please find page 109 of the 2011 SunTrust annual report below. You can navigate through the pages in the report by either clicking on the pages listed below, or by using the keyword search tool below to find specific information within the annual report.-
 1
1 -
2
-
3
-
4
-
5
-
6
-
7
-
8
-
9
-
10
-
11
-
12
-
13
-
14
-
15
-
16
-
17
-
18
-
19
-
20
-
21
-
22
-
23
-
24
-
25
-
26
-
27
-
28
-
29
-
30
-
31
-
32
-
33
-
34
-
35
-
36
-
37
-
38
-
39
-
40
-
41
-
42
-
43
-
44
-
45
-
46
-
47
-
48
-
49
-
50
-
51
-
52
-
53
-
54
-
55
-
56
-
57
-
58
-
59
-
60
-
61
-
62
-
63
-
64
-
65
-
66
-
67
-
68
-
69
-
70
-
71
-
72
-
73
-
74
-
75
-
76
-
77
-
78
-
79
-
80
-
81
-
82
-
83
-
84
-
85
-
86
-
87
-
88
-
89
-
90
-
91
-
92
-
93
-
94
-
95
-
96
-
97
-
98
-
 99
99 -
 100
100 -
 101
101 -
 102
102 -
 103
103 -
 104
104 -
 105
105 -
 106
106 -
 107
107 -
 108
108 -
 109
109 -
 110
110 -
 111
111 -
 112
112 -
 113
113 -
 114
114 -
 115
115 -
 116
116 -
 117
117 -
 118
118 -
 119
119 -
120
-
121
-
122
-
123
-
124
-
125
-
126
-
127
-
128
-
129
-
130
-
131
-
132
-
133
-
134
-
135
-
136
-
137
-
138
-
139
-
140
-
141
-
142
-
143
-
144
-
145
-
146
-
147
-
148
-
149
-
150
-
151
-
152
-
153
-
154
-
155
-
156
-
157
-
158
-
159
-
160
-
161
-
162
-
163
-
164
-
165
-
166
-
167
-
168
-
169
-
170
-
171
-
172
-
173
-
174
-
175
-
176
-
177
-
178
-
179
-
180
-
181
-
182
-
183
-
184
-
185
-
186
-
187
-
188
-
189
-
190
-
191
-
192
-
193
-
194
-
195
-
196
-
197
-
198
-
199
-
200
-
201
-
202
-
203
-
204
-
205
-
206
-
207
-
208
-
209
-
210
-
211
-
212
-
213
-
214
-
215
-
216
-
217
-
218
-
219
-
220
-
221
-
222
-
223
-
224
-
225
-
226
-
227
 |
 |
93
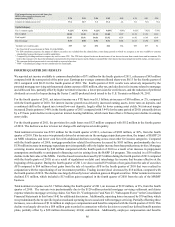
recognized in 2009 and higher servicing income. Partially offsetting these improvements were lower mortgage production income,
lower net interest income and higher provision for credit losses.
Net interest income was $458 million, down $42 million, or 8%. Net interest income on total average loans of $29.0 billion was
up $54 million, or 25%, due to higher spreads. Offsetting this positive variance was a decline in income from LHFS of $93 million
due to a decline in average LHFS of $2.1 billion, or 46%.
Provision for credit losses increased $58 million, or 5%. The increase was predominantly due to specific actions taken in the first
quarter of 2010 which resulted in additional charge-offs recognized on severely delinquent residential mortgage NPLs,
predominantly in Florida, as well as $51 million in additional charge-offs related to $211 million loans that were reclassified to
LHFS and subsequently sold.
Total noninterest income was $521 million, down $166 million, or 24%. The decline was predominantly due to lower production
income. Mortgage loan production income declined $251 million, or 69%, predominantly due to lower loan production. Loan
originations were $29.3 billion in 2010, a 42% decrease from the prior year. Mortgage servicing income was up $66 million driven
by lower decay due to slower prepayments on MSR values. Total loans serviced at December 31, 2010 were $167.2 billion compared
with $178.9 billion at December 31, 2009, a 7% decline predominantly due to the sale of MSRs on residential loans with unpaid
principal balances of $7.0 billion.
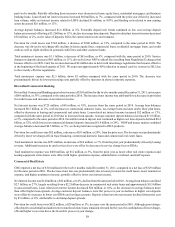
Total noninterest expense declined $324 million, or 23%, predominantly due to a $279 million non-cash goodwill impairment
charge recorded in first quarter of 2009. Total staff expense declined $76 million, or 16%, due to lower commission expense
resulting from lower loan production. Captive reinsurance reserve expense also decreased as a result of trust reserve limits being
reached. These decreases were partially offset by higher allocated credit and technology costs.
Wealth and Investment Management
W&IM's net income for the twelve months ended December 31, 2010 was $138 million, an increase of $38 million, or 38%,
compared with the same period in 2009. The increase in net income was predominantly due to an increase in net interest income,
higher trust and trading income, and the net gain from the sale of the RidgeWorth Money Market Fund business to Federated
Investors, Inc., partially offset by an increase in noninterest expense.
Net interest income was $385 million, an increase of $40 million, or 12%, driven mostly by deposit-related net interest income.
Average loan balances declined $331 million, or 4% with decreases in construction, home equity lines, commercial real estate,
residential mortgages, and consumer direct categories, but were partially offset by increases in personal credit lines and commercial
loans. Loan-related net interest income increased $10 million, or 8%, as higher loan spreads more than offset the decrease in
average loan balances. Average customer deposits increased $130 million, or 1%, as money market accounts increased $1.3 billion,
or 48%. Additionally, demand deposits increased $139 million, or 7%, while time deposits decreased $703 million, or 34%, and
NOW accounts decreased $612 million, or 14%. Deposit-related net interest income increased $21 million, or 9%, due to the
combination of higher average balances and improved deposit spreads.
Provision for credit losses was $61 million, a decrease of $18 million, or 23%, due to decreased net charge-offs in both consumer
and commercial loan products.
Total noninterest income was $821 million, an increase of $67 million, or 9%. Trust income increased $17 million, or 3%,
predominantly due to higher market valuations on managed equity assets and fixed income asset inflows partially offset by lower
MMMF revenue. Trading income increased $29 million due to higher valuations on trading assets and the sale of certain CLO
equity positions. Additionally, other income increased $26 million predominantly due to an $18 million gain from the sale of the
RidgeWorth Money Market Fund business. These increases were partially offset by a $9 million, or 5%, decline in retail investment
income primarily driven by lower fixed annuity revenue. The fixed annuity revenue decline was partially offset by increased
recurring brokerage revenue and increased transactional revenue from variable annuities, mutual fund sales, and managed account
fees.
As of December 31, 2010, assets under management were approximately $105.1 billion compared with $119.5 billion as of
December 31, 2009. Assets under management include individually managed assets, the RidgeWorth Funds, managed institutional
assets, and participant-directed retirement accounts. The December 31, 2009 assets under management included approximately
$18.0 billion of MMMF assets. SunTrust completed the sale of the money market fund business to Federated Investors, Inc. in
the fourth quarter 2010. SunTrust's total assets under advisement were approximately $195.5 billion, which includes $105.1 billion
in assets under management, $46.0 billion in non-managed trust assets, $34.6 billion in retail brokerage assets, and $9.8 billion
in non-managed corporate trust assets.