SunTrust 2011 Annual Report Download - page 82
Download and view the complete annual report
Please find page 82 of the 2011 SunTrust annual report below. You can navigate through the pages in the report by either clicking on the pages listed below, or by using the keyword search tool below to find specific information within the annual report.-
 1
1 -
2
-
3
-
4
-
5
-
6
-
7
-
8
-
9
-
10
-
11
-
12
-
13
-
14
-
15
-
16
-
17
-
18
-
19
-
20
-
21
-
22
-
23
-
24
-
25
-
26
-
27
-
28
-
29
-
30
-
31
-
32
-
33
-
34
-
35
-
36
-
37
-
38
-
39
-
40
-
41
-
42
-
43
-
44
-
45
-
46
-
47
-
48
-
49
-
50
-
51
-
52
-
53
-
54
-
55
-
56
-
57
-
58
-
59
-
60
-
61
-
62
-
63
-
64
-
65
-
66
-
67
-
68
-
69
-
70
-
71
-
 72
72 -
 73
73 -
 74
74 -
 75
75 -
 76
76 -
 77
77 -
 78
78 -
 79
79 -
 80
80 -
 81
81 -
 82
82 -
 83
83 -
 84
84 -
 85
85 -
 86
86 -
 87
87 -
 88
88 -
 89
89 -
 90
90 -
 91
91 -
 92
92 -
93
-
94
-
95
-
96
-
97
-
98
-
99
-
100
-
101
-
102
-
103
-
104
-
105
-
106
-
107
-
108
-
109
-
110
-
111
-
112
-
113
-
114
-
115
-
116
-
117
-
118
-
119
-
120
-
121
-
122
-
123
-
124
-
125
-
126
-
127
-
128
-
129
-
130
-
131
-
132
-
133
-
134
-
135
-
136
-
137
-
138
-
139
-
140
-
141
-
142
-
143
-
144
-
145
-
146
-
147
-
148
-
149
-
150
-
151
-
152
-
153
-
154
-
155
-
156
-
157
-
158
-
159
-
160
-
161
-
162
-
163
-
164
-
165
-
166
-
167
-
168
-
169
-
170
-
171
-
172
-
173
-
174
-
175
-
176
-
177
-
178
-
179
-
180
-
181
-
182
-
183
-
184
-
185
-
186
-
187
-
188
-
189
-
190
-
191
-
192
-
193
-
194
-
195
-
196
-
197
-
198
-
199
-
200
-
201
-
202
-
203
-
204
-
205
-
206
-
207
-
208
-
209
-
210
-
211
-
212
-
213
-
214
-
215
-
216
-
217
-
218
-
219
-
220
-
221
-
222
-
223
-
224
-
225
-
226
-
227
 |
 |
66
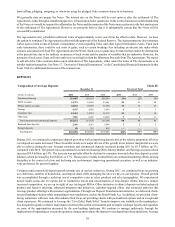
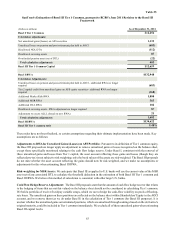
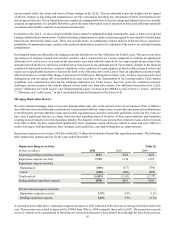
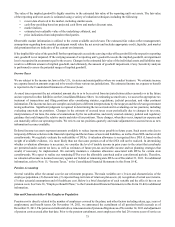
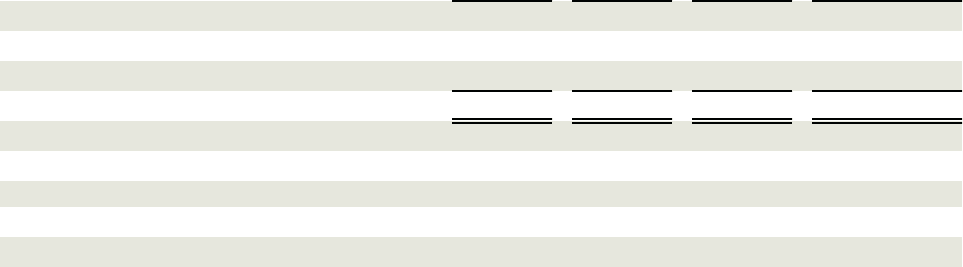
The following table summarizes the original principal balance of loans sold from 2006 to 2008, excluding loans sold to Ginnie
Mae, as well as the cumulative default rate and repurchase request rate.
Original Principal Balance Sold
(Dollars in billions)
Sold unpaid principal balance
GSEs
Non-agency
Total sold unpaid principal balance
Ever-120 days past due1
Ever-120 days past due/sold unpaid principal balance
Total repurchase requests received
Total repurchase requests/ever-120 days past due
1 Includes estimates for delinquent loans sold servicing released
2006
$30.2
11.9
$42.1
$7.6
18.0%
$1.6
21.0%
2007
$40.8
9.4
$50.2
$10.7
21.4%
$2.3
22.1%
2008
$27.6
0.1
$27.7
$2.9
10.5%
$0.5
16.4%
Table 27
Total
$98.6
21.4
$120.0
$21.2
17.7%
$4.4
20.9%
As previously noted, repurchase requests received during 2011 primarily related to loans sold in 2007. The volume of repurchase
requests from a particular sale vintage is driven by several factors. The primary factor is the volume of defaulted loans. As shown
above, the largest volume of defaulted loans is from 2007 due to the volume of sales during that year, combined with the credit
guidelines applicable to loans originated during that period. To date, repurchase request volumes were also driven by the inverse
relationship between repurchase requests and the amount of time between origination and default. That is, the shorter the timeframe
between origination and default, the greater the repurchase request volume; and the longer the timeframe, the lower the repurchase
request volume. Because of this relationship, fewer repurchase requests received during 2011 were from loans sold prior to 2006
and, to a lesser extent, 2006 while requests from loans sold in 2007 and 2008 were higher.
Another factor is the investor selection and review process. We believe that the GSEs have primarily focused on defaulted loans
that have been through the foreclosure process and have been less focused on outstanding loans that are seriously delinquent. We
believe this is because the final resolution of an outstanding delinquent loan is not certain and also due to the backlog of foreclosed
loans. However, we have recently noticed some change in the pattern of requests. The more recent selections, as evidenced by
the GSEs' requests for full loan files, have shifted towards outstanding loans that are seriously delinquent. This could suggest that
the GSEs are working through the backlog of defaulted loans from prior years and that the repurchase requests in the latter half
of 2011 were due to an acceleration of timing of repurchase requests as opposed to an increase in the total population of requests.
Our liability for losses resulting from loan repurchases is initially based upon the fair value of these guarantees. Subsequently, the
liability is reduced in proportion to the reduction in risk as actual losses are incurred, and additions to the liability are made for
our estimate of incurred losses. The liability is calculated by sales vintage based on various factors including:
• pending repurchase demands,
• the population of loans that have ever been 120 or more days past due, including loans currently delinquent that are
expected to migrate to 120 days past due,
• the probability that a repurchase request related to a loan that has ever been 120 or more days past due will be
received,
• the probability that a loan demanded for repurchase will be repurchased, and
• historical loss experience.