PNC Bank 2007 Annual Report Download - page 96
Download and view the complete annual report
Please find page 96 of the 2007 PNC Bank annual report below. You can navigate through the pages in the report by either clicking on the pages listed below, or by using the keyword search tool below to find specific information within the annual report.-
 1
1 -
2
-
3
-
4
-
5
-
6
-
7
-
8
-
9
-
10
-
11
-
12
-
13
-
14
-
15
-
16
-
17
-
18
-
19
-
20
-
21
-
22
-
23
-
24
-
25
-
26
-
27
-
28
-
29
-
30
-
31
-
32
-
33
-
34
-
35
-
36
-
37
-
38
-
39
-
40
-
41
-
42
-
43
-
44
-
45
-
46
-
47
-
48
-
49
-
50
-
51
-
52
-
53
-
54
-
55
-
56
-
57
-
58
-
59
-
60
-
61
-
62
-
63
-
64
-
65
-
66
-
67
-
68
-
69
-
70
-
71
-
72
-
73
-
74
-
75
-
76
-
77
-
78
-
79
-
80
-
81
-
82
-
83
-
84
-
85
-
 86
86 -
 87
87 -
 88
88 -
 89
89 -
 90
90 -
 91
91 -
 92
92 -
 93
93 -
 94
94 -
 95
95 -
 96
96 -
 97
97 -
 98
98 -
 99
99 -
 100
100 -
 101
101 -
 102
102 -
 103
103 -
 104
104 -
 105
105 -
 106
106 -
107
-
108
-
109
-
110
-
111
-
112
-
113
-
114
-
115
-
116
-
117
-
118
-
119
-
120
-
121
-
122
-
123
-
124
-
125
-
126
-
127
-
128
-
129
-
130
-
131
-
132
-
133
-
134
-
135
-
136
-
137
-
138
-
139
-
140
-
141
 |
 |

N
OTE
8C
OMMERCIAL
M
ORTGAGE
L
OAN
S
ALES AND
R
ETAINED
I
NTERESTS
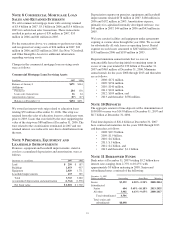
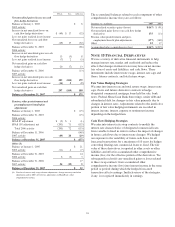
We sold commercial mortgage loans with servicing retained
of $3.4 billion in 2007, $3.1 billion in 2006 and $3.4 billion in
2005 for cash in loan sales transactions. These transactions
resulted in pretax net gains of $39 million in 2007, $55
million in 2006 and $61 million in 2005.
For the transactions above, we continue to perform servicing
and recognized servicing assets of $26 million in 2007, $24
million in 2006 and $23 million in 2005. See Note 7 Goodwill
and Other Intangible Assets for additional information
regarding servicing assets.
Changes in the commercial mortgage loan servicing assets
were as follows:
Commercial Mortgage Loan Servicing Assets
In millions 2007 2006
Balance at January 1 $471 $344
Additions
Purchases 284 150
Loan sales transactions 26 24
Amortization expense (87) (47)
Balance at December 31 $694 $471
We owned an interest-only strip related to education loans
totaling $59 million at December 31, 2006. This strip was
retained from the sales of education loans to a third party trust
prior to 2003. Loans that were held by the trust supporting the
value of the strip were $88 million at December 31, 2006. The
trust related to the securitization terminated in 2007 and our
retained interest was reduced to zero due to distributions from
the trust.
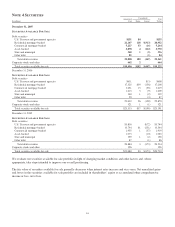
N
OTE
9P
REMISES
,E
QUIPMENT AND
L
EASEHOLD
I
MPROVEMENTS
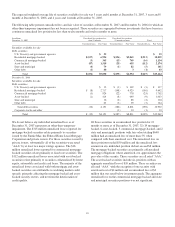
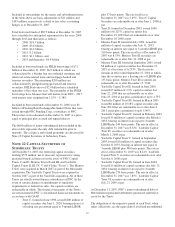
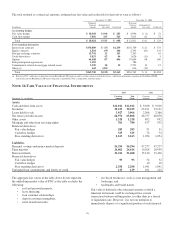
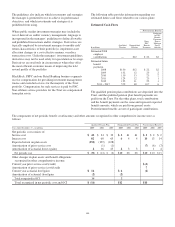
Premises, equipment and leasehold improvements, stated at
cost less accumulated depreciation and amortization, were as
follows:
December 31 - in millions 2007 2006
Land $ 250 $ 187
Buildings 1,053 937
Equipment 2,029 1,771
Leasehold improvements 433 385
Total 3,765 3,280
Accumulated depreciation and amortization (1,764) (1,578)
Net book value $ 2,001 $ 1,702
Depreciation expense on premises, equipment and leasehold
improvements totaled $178 million in 2007, $180 million in
2006 and $192 million in 2005. Amortization expense,
primarily for capitalized internally developed software, was
$40 million in 2007, $44 million in 2006 and $43 million in
2005.
We lease certain facilities and equipment under agreements
expiring at various dates through the year 2066. We account
for substantially all such leases as operating leases. Rental
expense on such leases amounted to $207 million in 2007,
$193 million in 2006 and $189 million in 2005.
Required minimum annual rentals that we owe on
noncancelable leases having initial or remaining terms in
excess of one year totaled $1.239 billion at December 31,
2007 and $965 million at December 31, 2006. Minimum
annual rentals for the years 2008 through 2013 and thereafter
are as follows:
• 2008: $172 million,
• 2009: $156 million,
• 2010: $140 million,
• 2011: $124 million,
• 2012: $109 million, and
• 2013 and thereafter: $538 million.
N
OTE
10 D
EPOSITS
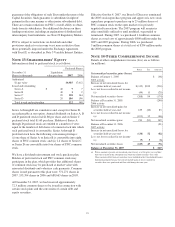
The aggregate amount of time deposits with a denomination of
$100,000 or more was $14.8 billion at December 31, 2007 and
$8.7 billion at December 31, 2006.
Total time deposits of $26.4 billion at December 31, 2007
have contractual maturities for the years 2008 through 2013
and thereafter as follows:
• 2008: $22.5 billion,
• 2009: $1.9 billion,
• 2010: $.6 billion,
• 2011: $.1 billion,
• 2012: $.2 billion, and
• 2013 and thereafter: $1.1 billion.
N
OTE
11 B
ORROWED
F
UNDS
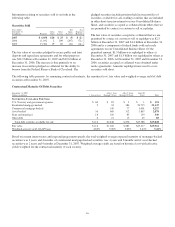
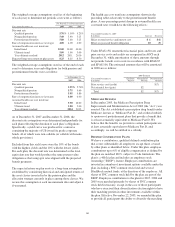
Bank notes at December 31, 2007 totaling $3.2 billion have
interest rates ranging from 2.75% to 10.25% with
approximately $3 billion maturing in 2008. Senior and
subordinated notes consisted of the following:
December 31, 2007
Dollars in millions Outstanding Stated Rate Maturity
Senior $3,592 4.20%–5.50% 2008-2014
Subordinated
Junior 604 5.69%–10.18% 2013-2035
All other 3,902 4.63%–9.65% 2008-2017
Total subordinated 4,506
Total senior and
subordinated $8,098
91