PNC Bank 2007 Annual Report Download - page 124
Download and view the complete annual report
Please find page 124 of the 2007 PNC Bank annual report below. You can navigate through the pages in the report by either clicking on the pages listed below, or by using the keyword search tool below to find specific information within the annual report.-
 1
1 -
2
-
3
-
4
-
5
-
6
-
7
-
8
-
9
-
10
-
11
-
12
-
13
-
14
-
15
-
16
-
17
-
18
-
19
-
20
-
21
-
22
-
23
-
24
-
25
-
26
-
27
-
28
-
29
-
30
-
31
-
32
-
33
-
34
-
35
-
36
-
37
-
38
-
39
-
40
-
41
-
42
-
43
-
44
-
45
-
46
-
47
-
48
-
49
-
50
-
51
-
52
-
53
-
54
-
55
-
56
-
57
-
58
-
59
-
60
-
61
-
62
-
63
-
64
-
65
-
66
-
67
-
68
-
69
-
70
-
71
-
72
-
73
-
74
-
75
-
76
-
77
-
78
-
79
-
80
-
81
-
82
-
83
-
84
-
85
-
86
-
87
-
88
-
89
-
90
-
91
-
92
-
93
-
94
-
95
-
96
-
97
-
98
-
99
-
100
-
101
-
102
-
103
-
104
-
105
-
106
-
107
-
108
-
109
-
110
-
111
-
112
-
113
-
 114
114 -
 115
115 -
 116
116 -
 117
117 -
 118
118 -
 119
119 -
 120
120 -
 121
121 -
 122
122 -
 123
123 -
 124
124 -
 125
125 -
 126
126 -
 127
127 -
 128
128 -
 129
129 -
 130
130 -
 131
131 -
 132
132 -
 133
133 -
 134
134 -
135
-
136
-
137
-
138
-
139
-
140
-
141
 |
 |

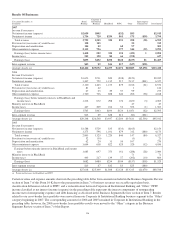
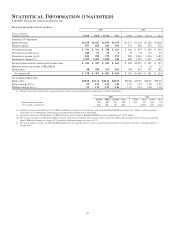
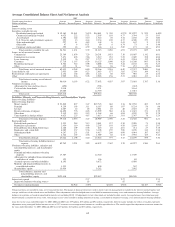
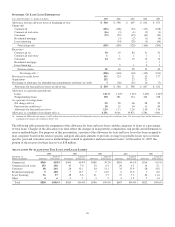
Average Consolidated Balance Sheet And Net Interest Analysis
2007 2006 2005
Taxable-equivalent basis
Dollars in millions
Average
Balances
Interest
Income/Expense
Average
Yields/Rates
Average
Balances
Interest
Income/Expense
Average
Yields/Rates
Average
Balances
Interest
Income/Expense
Average
Yields/Rates
Assets
Interest-earning assets
Securities available for sale
Residential mortgage-backed $ 19,163 $1,041 5.43% $14,881 $ 740 4.97% $11,922 $ 525 4.40%
Commercial mortgage-backed 4,025 222 5.52 2,305 110 4.77 1,394 55 3.95
Asset-backed 2,394 122 5.10 1,312 70 5.34 1,238 47 3.80
U.S. Treasury and government agencies 293 13 4.44 2,334 102 4.37 4,308 173 4.02
State and municipal 227 11 4.85 148 8 5.41 167 9 5.39
Other debt 47 4 8.51 89 6 6.74 73 4 5.48
Corporate stocks and other 392 18 4.59 246 14 5.69 173 12 6.94
Total securities available for sale 26,541 1,431 5.39 21,315 1,050 4.93 19,275 825 4.28
Loans, net of unearned income
Commercial 25,509 1,859 7.29 20,201 1,451 7.18 19,007 1,142 6.01
Commercial real estate 7,671 603 7.86 3,212 232 7.22 2,609 158 6.06
Lease financing 2,559 76 2.97 2,777 123 4.43 2,944 132 4.48
Consumer 17,718 1,167 6.59 16,125 1,009 6.26 16,208 905 5.58
Residential mortgage 8,564 512 5.98 6,888 375 5.44 6,136 321 5.23
Other 432 31 7.18 363 26 7.16 453 22 4.86
Total loans, net of unearned income 62,453 4,248 6.80 49,566 3,216 6.49 47,357 2,680 5.66
Loans held for sale 2,955 184 6.23 2,683 157 5.85 2,301 104 4.52
Federal funds sold and resale agreements 2,152 104 4.83 1,143 58 5.07 985 25 2.54
Other 3,909 226 5.78 2,985 156 5.23 3,083 133 4.31
Total interest-earning assets/interest
income 98,010 6,193 6.32 77,692 4,637 5.97 73,001 3,767 5.16
Noninterest-earning assets
Allowance for loan and lease losses (690) (591) (632)
Cash and due from banks 3,018 3,121 3,164
Other 23,080 14,790 13,015
Total assets $123,418 $95,012 $88,548
Liabilities, Minority and Noncontrolling Interests, and Shareholders' Equity
Interest-bearing liabilities
Interest-bearing deposits
Money market $ 23,840 827 3.47 $19,745 663 3.36 $17,930 403 2.25
Demand 9,259 103 1.11 8,187 88 1.07 8,224 56 .68
Savings 2,687 12 .45 2,081 10 .48 2,645 16 .60
Retail certificates of deposit 16,690 776 4.65 13,999 582 4.16 11,623 371 3.19
Other time 2,119 110 5.19 1,364 66 4.84 1,559 59 3.78
Time deposits in foreign offices 4,623 225 4.87 3,613 181 5.01 2,347 76 3.24
Total interest-bearing deposits 59,218 2,053 3.47 48,989 1,590 3.25 44,328 981 2.21
Borrowed funds
Federal funds purchased 5,533 284 5.13 3,081 157 5.10 2,098 71 3.38
Repurchase agreements 2,450 110 4.49 2,205 101 4.58 2,189 65 2.97
Federal Home Loan Bank borrowings 2,168 109 5.03 623 25 4.01 714 27 3.78
Bank notes and senior debt 6,282 337 5.36 3,128 159 5.08 3,198 114 3.56
Subordinated debt 4,247 251 5.91 4,417 269 6.09 4,044 197 4.87
Other 2,344 107 4.56 1,589 66 4.15 3,956 125 3.16
Total borrowed funds 23,024 1,198 5.20 15,043 777 5.17 16,199 599 3.70
Total interest-bearing liabilities/interest
expense 82,242 3,251 3.95 64,032 2,367 3.70 60,527 1,580 2.61
Noninterest-bearing liabilities, minority and
noncontrolling interests, and shareholders'
equity
Demand and other noninterest-bearing
deposits 17,587 14,320 13,309
Allowance for unfunded loan commitments
and letters of credit 125 106 80
Accrued expenses and other liabilities 8,195 6,672 6,098
Minority and noncontrolling interests in
consolidated entities 1,335 600 542
Shareholders' equity 13,934 9,282 7,992
Total liabilities, minority and
noncontrolling interests, and
shareholders' equity $123,418 $95,012 $88,548
Interest rate spread 2.37 2.27 2.55
Impact of noninterest-bearing sources .63 .65 .45
Net interest income/margin $2,942 3.00% $2,270 2.92% $2,187 3.00%
Nonaccrual loans are included in loans, net of unearned income. The impact of financial derivatives used in interest rate risk management is included in the interest income/expense and
average yields/rates of the related assets and liabilities. Basis adjustments related to hedged items are included in noninterest-earning assets and noninterest-bearing liabilities. Average
balances of securities are based on amortized historical cost (excluding SFAS 115 adjustments to fair value which are included in other assets). Average balances for certain loans and
borrowed funds accounted for at fair value, with changes in fair value recorded in trading noninterest income, are included in noninterest-earning assets and noninterest-bearing liabilities.
Loan fees for the years ended December 31, 2007, 2006 and 2005 were $39 million, $35 million and $91 million, respectively. Interest income includes the effects of taxable-equivalent
adjustments using a marginal federal income tax rate of 35% to increase tax-exempt interest income to a taxable-equivalent basis. The taxable-equivalent adjustments to interest income for
the years ended December 31, 2007, 2006 and 2005 were $27 million, $25 million and $33 million, respectively.
119