PNC Bank 2007 Annual Report Download - page 34
Download and view the complete annual report
Please find page 34 of the 2007 PNC Bank annual report below. You can navigate through the pages in the report by either clicking on the pages listed below, or by using the keyword search tool below to find specific information within the annual report.-
 1
1 -
2
-
3
-
4
-
5
-
6
-
7
-
8
-
9
-
10
-
11
-
12
-
13
-
14
-
15
-
16
-
17
-
18
-
19
-
20
-
21
-
22
-
23
-
 24
24 -
 25
25 -
 26
26 -
 27
27 -
 28
28 -
 29
29 -
 30
30 -
 31
31 -
 32
32 -
 33
33 -
 34
34 -
 35
35 -
 36
36 -
 37
37 -
 38
38 -
 39
39 -
 40
40 -
 41
41 -
 42
42 -
 43
43 -
 44
44 -
45
-
46
-
47
-
48
-
49
-
50
-
51
-
52
-
53
-
54
-
55
-
56
-
57
-
58
-
59
-
60
-
61
-
62
-
63
-
64
-
65
-
66
-
67
-
68
-
69
-
70
-
71
-
72
-
73
-
74
-
75
-
76
-
77
-
78
-
79
-
80
-
81
-
82
-
83
-
84
-
85
-
86
-
87
-
88
-
89
-
90
-
91
-
92
-
93
-
94
-
95
-
96
-
97
-
98
-
99
-
100
-
101
-
102
-
103
-
104
-
105
-
106
-
107
-
108
-
109
-
110
-
111
-
112
-
113
-
114
-
115
-
116
-
117
-
118
-
119
-
120
-
121
-
122
-
123
-
124
-
125
-
126
-
127
-
128
-
129
-
130
-
131
-
132
-
133
-
134
-
135
-
136
-
137
-
138
-
139
-
140
-
141
 |
 |

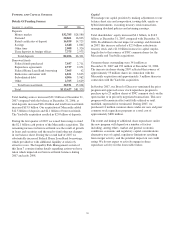
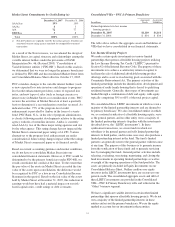
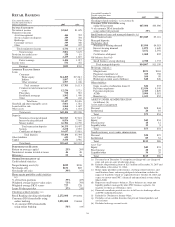
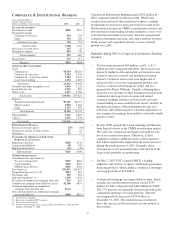
Risk-Based Capital
December 31 - dollars in millions 2007 2006
Capital components
Shareholders’ equity
Common $14,847 $10,781
Preferred 77
Trust preferred capital securities 572 965
Minority interest 985 494
Goodwill and other intangibles (8,853) (3,566)
Eligible deferred income taxes on
intangible assets 119 26
Pension, other postretirement and
postemployment benefit plan
adjustments 177 148
Net unrealized securities losses, after
tax 167 91
Net unrealized losses (gains) on cash
flow hedge derivatives, after tax (175) 13
Equity investments in nonfinancial
companies (31) (30)
Other, net (5)
Tier 1 risk-based capital 7,815 8,924
Subordinated debt 3,024 1,954
Eligible allowance for credit losses 964 681
Total risk-based capital $11,803 $11,559
Assets
Risk-weighted assets, including
off-balance sheet instruments and
market risk equivalent assets $115,132 $85,539
Adjusted average total assets 126,139 95,590
Capital ratios
Tier 1 risk-based 6.8% 10.4%
Total risk-based 10.3 13.5
Leverage 6.2 9.3
Tangible capital
Common shareholders’ equity $14,847 $10,781
Goodwill and other intangibles (8,853) (3,566)
Eligible deferred income taxes on
intangible assets 119 26
Tangible capital $6,113 $7,241
Total assets excluding goodwill and
other intangible assets, net of
eligible deferred income taxes $130,185 $98,280
Tangible common equity 4.7% 7.4%
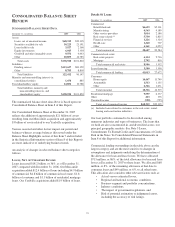
The declines in capital ratios from December 31, 2006 were
primarily due to the impact of acquisitions, which increased
risk-weighted assets and goodwill, common share repurchases
and organic balance sheet growth.
The access to, and cost of, funding new business initiatives
including acquisitions, the ability to engage in expanded business
activities, the ability to pay dividends, the level of deposit
insurance costs, and the level and nature of regulatory oversight
depend, in part, on a financial institution's capital strength.
At December 31, 2007 and December 31, 2006, each of our
domestic bank subsidiaries was considered “well capitalized”
based on US regulatory capital ratio requirements. See the
Supervision And Regulation section of Item 1 of this Report
and Note 22 Regulatory Matters in the Notes To Consolidated
Financial Statements in Item 8 of this Report for additional
information. We believe our bank subsidiaries will continue to
meet these requirements in 2008.
We refer you to the “Perpetual Trust Securities” and “PNC
Capital Trust E Trust Preferred Securities” portions of the
Off-Balance Sheet Arrangements And VIEs section of this
Item 7 for a discussion of two February 2008 hybrid capital
securities issuances totaling $825 million that qualify as Tier 1
regulatory capital.
O
FF
-B
ALANCE
S
HEET
A
RRANGEMENTS
A
ND
VIE
S
We engage in a variety of activities that involve unconsolidated
entities or that are otherwise not reflected in our Consolidated
Balance Sheet that are generally referred to as “off-balance
sheet arrangements.” The following sections of this Report
provide further information on these types of activities:
• Commitments, including contractual obligations and
other commitments, included within the Risk
Management section of this Item 7, and
• Note 24 Commitments and Guarantees in the Notes
To Consolidated Financial Statements included in
Item 8 of this Report.
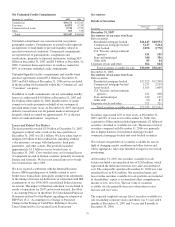
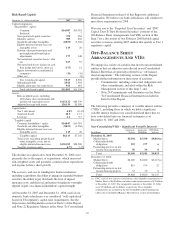
The following provides a summary of variable interest entities
(“VIEs”), including those in which we hold a significant
variable interest but have not consolidated and those that we
have consolidated into our financial statements as of
December 31, 2007 and 2006.
Non-Consolidated VIEs – Significant Variable Interests
In millions
Aggregate
Assets
Aggregate
Liabilities
PNC Risk
of Loss
December 31, 2007
Market Street $5,304 $5,330 $9,019(a)
Collateralized debt
obligations 255 177 6
Partnership interests in low
income housing projects 50 34 8
Total $5,609 $5,541 $9,033
December 31, 2006
Market Street $4,020 $4,020 $6,117(a)
Collateralized debt
obligations 815 570 22
Partnership interests in low
income housing projects 33 30 8
Total $4,868 $4,620 $6,147
(a) PNC’s risk of loss consists of off-balance sheet liquidity commitments to
Market Street of $8.8 billion and other credit enhancements of $.2 billion
at December 31, 2007. The comparable amounts at December 31, 2006
were $5.6 billion and $.6 billion, respectively. These liquidity
commitments are included in the Net Unfunded Credit Commitments
table in the Consolidated Balance Sheet Review section of this Report.
29