PNC Bank 2007 Annual Report Download - page 31
Download and view the complete annual report
Please find page 31 of the 2007 PNC Bank annual report below. You can navigate through the pages in the report by either clicking on the pages listed below, or by using the keyword search tool below to find specific information within the annual report.-
 1
1 -
2
-
3
-
4
-
5
-
6
-
7
-
8
-
9
-
10
-
11
-
12
-
13
-
14
-
15
-
16
-
17
-
18
-
19
-
20
-
 21
21 -
 22
22 -
 23
23 -
 24
24 -
 25
25 -
 26
26 -
 27
27 -
 28
28 -
 29
29 -
 30
30 -
 31
31 -
 32
32 -
 33
33 -
 34
34 -
 35
35 -
 36
36 -
 37
37 -
 38
38 -
 39
39 -
 40
40 -
 41
41 -
42
-
43
-
44
-
45
-
46
-
47
-
48
-
49
-
50
-
51
-
52
-
53
-
54
-
55
-
56
-
57
-
58
-
59
-
60
-
61
-
62
-
63
-
64
-
65
-
66
-
67
-
68
-
69
-
70
-
71
-
72
-
73
-
74
-
75
-
76
-
77
-
78
-
79
-
80
-
81
-
82
-
83
-
84
-
85
-
86
-
87
-
88
-
89
-
90
-
91
-
92
-
93
-
94
-
95
-
96
-
97
-
98
-
99
-
100
-
101
-
102
-
103
-
104
-
105
-
106
-
107
-
108
-
109
-
110
-
111
-
112
-
113
-
114
-
115
-
116
-
117
-
118
-
119
-
120
-
121
-
122
-
123
-
124
-
125
-
126
-
127
-
128
-
129
-
130
-
131
-
132
-
133
-
134
-
135
-
136
-
137
-
138
-
139
-
140
-
141
 |
 |

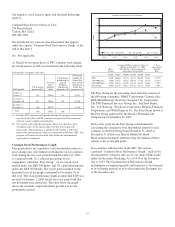
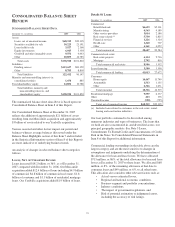
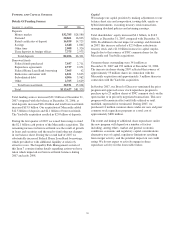
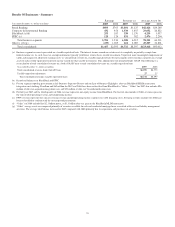
Net Unfunded Credit Commitments
December 31 - in millions 2007 2006
Commercial $39,171 $32,265
Consumer 10,875 9,239
Commercial real estate 2,734 2,752
Other 567 579
Total $53,347 $44,835
Unfunded commitments are concentrated in our primary
geographic markets. Commitments to extend credit represent
arrangements to lend funds or provide liquidity subject to
specified contractual conditions. Commercial commitments
are reported net of participations, assignments and
syndications, primarily to financial institutions, totaling $8.9
billion at December 31, 2007 and $8.3 billion at December 31,
2006. Consumer home equity lines of credit accounted for
80% of consumer unfunded credit commitments.
Unfunded liquidity facility commitments and standby bond
purchase agreements totaled $9.4 billion at December 31,
2007 and $6.0 billion at December 31, 2006 and are included
in the preceding table primarily within the “Commercial” and
“Consumer” categories.
In addition to credit commitments, our net outstanding standby
letters of credit totaled $4.8 billion at December 31, 2007 and
$4.4 billion at December 31, 2006. Standby letters of credit
commit us to make payments on behalf of our customers if
specified future events occur. At December 31, 2007, the largest
industry concentration was for general medical and surgical
hospitals, which accounted for approximately 5% of the total
letters of credit and bankers’ acceptances.
Leases and Related Tax Matters
The lease portfolio totaled $3.5 billion at December 31, 2007.
Aggregate residual value at risk on the lease portfolio at
December 31, 2007 was $1.1 billion. We have taken steps to
mitigate $.6 billion of this residual risk, including residual
value insurance coverage with third parties, third party
guarantees, and other actions. The portfolio included
approximately $1.7 billion of cross-border leases at
December 31, 2007. Cross-border leases are leveraged leases
of equipment located in foreign countries, primarily in western
Europe and Australia. We have not entered into cross-border
lease transactions since 2003.
We have reached a settlement with the Internal Revenue
Service (IRS) regarding our tax liability related to cross-
border lease transactions, principally arising from adjustments
to the timing of income tax deductions in connection with IRS
examinations of our 1998-2003 consolidated Federal income
tax returns. The impact of the final settlement was included in
results of operations for 2007 and was not material. See Note
1 Accounting Policies in the Notes To Consolidated Financial
Statements in Item 8 of this Report regarding our adoption of
FSP FAS 13-2, “Accounting for a Change or Projected
Change in the Timing of Cash Flows Relating to Income
Taxes Generated by a Leveraged Lease Transaction.”
S
ECURITIES
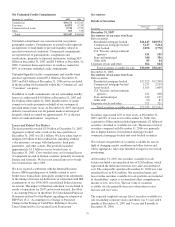
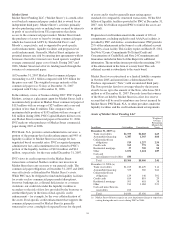
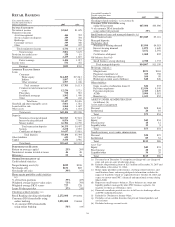
Details of Securities
In millions
Amortized
Cost
Fair
Value
December 31, 2007
S
ECURITIES
A
VAILABLE FOR
S
ALE
Debt securities
Residential mortgage-backed $21,147 $20,952
Commercial mortgage-backed 5,227 5,264
Asset-backed 2,878 2,770
U.S. Treasury and government
agencies 151 155
State and municipal 340 336
Other debt 85 84
Corporate stocks and other 662 664
Total securities available for sale $30,490 $30,225
December 31, 2006
S
ECURITIES
A
VAILABLE FOR
S
ALE
Debt securities
Residential mortgage-backed $17,325 $17,208
Commercial mortgage-backed 3,231 3,219
Asset-backed 1,615 1,609
U.S. Treasury and government
agencies 611 608
State and municipal 140 139
Other debt 90 87
Corporate stocks and other 321 321
Total securities available for sale $23,333 $23,191
Securities represented 22% of total assets at December 31,
2007 and 23% of total assets at December 31, 2006. Our
acquisition of Mercantile included approximately $2 billion of
securities classified as available for sale. The increase in total
securities compared with December 31, 2006 was primarily
due to higher balances in residential mortgage-backed,
commercial mortgage-backed and asset-backed securities.
We evaluate our portfolio of securities available for sale in
light of changing market conditions and other factors and,
where appropriate, take steps intended to improve our overall
positioning.
At December 31, 2007, the securities available for sale
balance included a net unrealized loss of $265 million, which
represented the difference between fair value and amortized
cost. The comparable amount at December 31, 2006 was a net
unrealized loss of $142 million. Net unrealized gains and
losses in the securities available for sale portfolio are included
in shareholders’ equity as accumulated other comprehensive
income or loss, net of tax. The fair value of securities
available for sale generally decreases when interest rates
increase and vice versa.
The expected weighted-average life of securities available for
sale (excluding corporate stocks and other) was 3 years and 6
months at December 31, 2007 and 3 years and 8 months at
December 31, 2006.
26