PNC Bank 2007 Annual Report Download - page 125
Download and view the complete annual report
Please find page 125 of the 2007 PNC Bank annual report below. You can navigate through the pages in the report by either clicking on the pages listed below, or by using the keyword search tool below to find specific information within the annual report.-
 1
1 -
2
-
3
-
4
-
5
-
6
-
7
-
8
-
9
-
10
-
11
-
12
-
13
-
14
-
15
-
16
-
17
-
18
-
19
-
20
-
21
-
22
-
23
-
24
-
25
-
26
-
27
-
28
-
29
-
30
-
31
-
32
-
33
-
34
-
35
-
36
-
37
-
38
-
39
-
40
-
41
-
42
-
43
-
44
-
45
-
46
-
47
-
48
-
49
-
50
-
51
-
52
-
53
-
54
-
55
-
56
-
57
-
58
-
59
-
60
-
61
-
62
-
63
-
64
-
65
-
66
-
67
-
68
-
69
-
70
-
71
-
72
-
73
-
74
-
75
-
76
-
77
-
78
-
79
-
80
-
81
-
82
-
83
-
84
-
85
-
86
-
87
-
88
-
89
-
90
-
91
-
92
-
93
-
94
-
95
-
96
-
97
-
98
-
99
-
100
-
101
-
102
-
103
-
104
-
105
-
106
-
107
-
108
-
109
-
110
-
111
-
112
-
113
-
114
-
 115
115 -
 116
116 -
 117
117 -
 118
118 -
 119
119 -
 120
120 -
 121
121 -
 122
122 -
 123
123 -
 124
124 -
 125
125 -
 126
126 -
 127
127 -
 128
128 -
 129
129 -
 130
130 -
 131
131 -
 132
132 -
 133
133 -
 134
134 -
 135
135 -
136
-
137
-
138
-
139
-
140
-
141
 |
 |

L
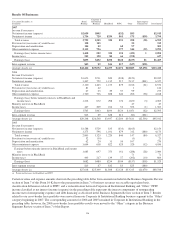
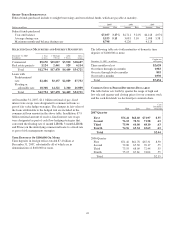
OANS
O
UTSTANDING
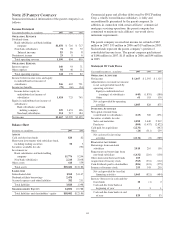
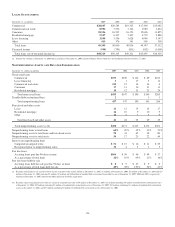
December 31 - in millions 2007 2006 2005 2004 2003
Commercial $28,607 $20,584 $19,325 $17,438 $15,082
Commercial real estate 8,906 3,532 3,162 1,980 1,824
Consumer 18,326 16,515 16,173 15,606 11,855
Residential mortgage 9,557 6,337 7,307 4,772 2,886
Lease financing 3,500 3,556 3,628 4,096 5,147
Other 413 376 341 505 518
Total loans 69,309 50,900 49,936 44,397 37,312
Unearned income (990) (795) (835) (902) (1,009)
Total loans, net of unearned income (a) $68,319 $50,105 $49,101 $43,495 $36,303
(a) Includes $2.3 billion at December 31, 2004 and $2.2 billion at December 31, 2003 related to Market Street, which was deconsolidated effective October 17, 2005.
N
ONPERFORMING
A
SSETS AND
R
ELATED
I
NFORMATION
December 31 - dollars in millions 2007 2006 2005 2004 2003
Nonaccrual loans
Commercial $193 $109 $ 134 $ 89 $213
Lease financing 3117 511
Commercial real estate 212 12 14 14 6
Consumer 17 13 10 11 11
Residential mortgage 10 12 15 21 24
Total nonaccrual loans $435 $147 $ 190 $140 $265
Troubled debt restructured loan 231
Total nonperforming loans 437 147 190 143 266
Foreclosed and other assets
Lease 11 12 13 14 17
Residential mortgage 16 10 9 10 9
Other 14 2 359
Total foreclosed and other assets 41 24 25 29 35
Total nonperforming assets (a) (b) $478 $171 $ 215 $172 $301
Nonperforming loans to total loans .64% .29% .39% .33% .73%
Nonperforming assets to total loans and foreclosed assets .70 .34 .42 .38 .80
Nonperforming assets to total assets .34 .17 .23 .22 .44
Interest on nonperforming loans
Computed on original terms $51 $15 $ 16 $11 $29
Recognized prior to nonperforming status 32 4 525
Past due loans
Accruing loans past due 90 days or more $106 $50 $ 46 $49 $57
As a percentage of total loans .16% .10% .09% .11% .16%
Past due loans held for sale
Accruing loans held for sale past due 90 days or more $8 $9$47$9$6
As a percentage of total loans held for sale .20% .38% 1.92% .54% .43%
(a) Excludes loans held for sale carried at lower of cost or market value of $25 million at December 31, 2007, $1 million at December 31, 2005, $3 million at December 31, 2004 and $27
million at December 31, 2003 (includes $1 million, $2 million and $10 million of troubled debt restructured loans held for sale at December 31, 2005, 2004 and 2003, respectively).
Amount at December 31, 2007 related to the Mercantile and Yardville acquisitions.
(b) Excludes equity management assets that are carried at estimated fair value of $4 million at December 31, 2007, $11 million (including $4 million of troubled debt restructured assets)
at December 31, 2006, $25 million (including $7 million of troubled debt restructured assets) at December 31, 2005, $32 million (including $11 million of troubled debt restructured
assets) at December 31, 2004, and $37 million (including $5 million of troubled debt restructured assets) at December 31, 2003.
120