PNC Bank 2007 Annual Report Download - page 64
Download and view the complete annual report
Please find page 64 of the 2007 PNC Bank annual report below. You can navigate through the pages in the report by either clicking on the pages listed below, or by using the keyword search tool below to find specific information within the annual report.-
 1
1 -
2
-
3
-
4
-
5
-
6
-
7
-
8
-
9
-
10
-
11
-
12
-
13
-
14
-
15
-
16
-
17
-
18
-
19
-
20
-
21
-
22
-
23
-
24
-
25
-
26
-
27
-
28
-
29
-
30
-
31
-
32
-
33
-
34
-
35
-
36
-
37
-
38
-
39
-
40
-
41
-
42
-
43
-
44
-
45
-
46
-
47
-
48
-
49
-
50
-
51
-
52
-
53
-
 54
54 -
 55
55 -
 56
56 -
 57
57 -
 58
58 -
 59
59 -
 60
60 -
 61
61 -
 62
62 -
 63
63 -
 64
64 -
 65
65 -
 66
66 -
 67
67 -
 68
68 -
 69
69 -
 70
70 -
 71
71 -
 72
72 -
 73
73 -
 74
74 -
75
-
76
-
77
-
78
-
79
-
80
-
81
-
82
-
83
-
84
-
85
-
86
-
87
-
88
-
89
-
90
-
91
-
92
-
93
-
94
-
95
-
96
-
97
-
98
-
99
-
100
-
101
-
102
-
103
-
104
-
105
-
106
-
107
-
108
-
109
-
110
-
111
-
112
-
113
-
114
-
115
-
116
-
117
-
118
-
119
-
120
-
121
-
122
-
123
-
124
-
125
-
126
-
127
-
128
-
129
-
130
-
131
-
132
-
133
-
134
-
135
-
136
-
137
-
138
-
139
-
140
-
141
 |
 |
expansion of the branch network, including our expansion into
the greater Washington, DC area that began in May 2005, and
various pricing actions resulting from the One PNC initiative
all contributed to the increase in 2006.
Brokerage fees increased $21 million, to $246 million, for
2006 compared with the prior year. The increase was
primarily due to higher annuity income and mutual fund-
related revenues, including favorable production from the
fee-based fund advisory business.
Consumer services fees increased $72 million, to $365
million, in 2006 compared with 2005. Higher fees reflected
the impact of consolidating our merchant services activities in
the fourth quarter of 2005 as a result of our increased
ownership interest in the merchant services business. The
increase was also due to higher debit card revenues resulting
from higher transaction volumes, our expansion into the
greater Washington, DC area, and pricing actions related to
the One PNC initiative. These factors were partially offset by
lower ATM surcharge revenue in 2006 resulting from
changing customer behavior and a strategic decision to reduce
the out-of-footprint ATM network.
Corporate services revenue was $626 million for 2006,
compared with $485 million in 2005. The increase in
corporate services revenue compared with the prior year was
primarily due to the full year benefit in 2006 of our October
2005 acquisition of Harris Williams.
Equity management (private equity) net gains on portfolio
investments totaled $107 million in 2006 and $96 million for
2005. Based on the nature of private equity activities, net
gains or losses may be volatile from period to period.
Net securities losses totaled $207 million in 2006 and $41
million in 2005. We took actions during the third quarter of
2006 that resulted in the sale of approximately $6 billion of
securities available for sale at an aggregate pretax loss of $196
million during that quarter.
Noninterest revenue from trading activities, which is primarily
customer-related, totaled $183 million in 2006 compared with
$157 million for 2005. We provide additional information on
our trading activities under Market Risk Management –
Trading Risk in the Risk Management section of this Item 7.
Net gains related to our BlackRock investment were $2.066
billion in 2006, comprised of the $2.078 billion gain on the
BlackRock/MLIM transaction partially offset by a fourth
quarter mark-to-market adjustment of $12 million on our
BlackRock LTIP obligation. See the BlackRock portion of the
Business Segments Review section of this Item 7 for further
information.
Other noninterest income decreased $57 million, to $315
million, in 2006 compared with 2005. Other noninterest
income for 2006 included the impact of a $48 million pretax
loss incurred in the third quarter of 2006 in connection with
the rebalancing of our residential mortgage portfolio.
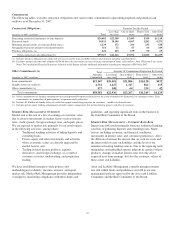
Noninterest Expense
Total noninterest expense was $4.443 billion for 2006, an
increase of $137 million compared with 2005. Item 6 of this
Report includes our efficiency ratios for 2006 and 2005 and
information regarding certain significant items impacting
noninterest income and expense in 2006.
Noninterest expense for 2006 included the following:
• Our share of integration costs related to the
BlackRock/MLIM transaction totaling $91 million,
which were almost entirely offset by a decrease in
other BlackRock expenses of $87 million due to our
deconsolidation of BlackRock effective
September 29, 2006,
• An increase of $71 million of expenses related to
Harris Williams, which we acquired in October 2005,
• An increase of $60 million related to the
consolidation of our merchant services activities in
the fourth quarter of 2005, and
• An increase of $23 million in PFPC’s distribution/
out-of-pocket expenses, the increase of which was
entirely offset in noninterest income and which had
no impact on our earnings.
Apart from the impact of these items, noninterest expense for
2006 decreased $21 million compared with 2005 as the benefit
of the One PNC initiative more than offset the impact of our
expansion into the greater Washington, DC area and other
investments in the business.
E
FFECTIVE
T
AX
R
ATE
Our effective tax rate was 34% for 2006 and 30.2% for 2005.
The Consolidated Income Statement Review section of this
Item 7 outlines the factors that contributed to the 2006
effective tax rate. The effective tax rate for 2005 reflected the
benefit in that year of a reversal of deferred tax liabilities in
connection with the transfer of our ownership in BlackRock to
our intermediate bank holding company. This transaction
reduced our first quarter 2005 tax provision by $45 million, or
$.16 per diluted share.
C
ONSOLIDATED
B
ALANCE
S
HEET
R
EVIEW
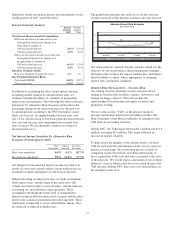
Loans
Loans increased $1.0 billion, or 2%, as of December 31, 2006
compared with December 31, 2005. Increases in total
commercial lending and consumer loans, driven by targeted
sales efforts across our banking businesses, more than offset
the decline in residential mortgage loans that resulted
primarily from our third quarter 2006 mortgage loan
repositioning.
Securities
Total securities at December 31, 2006 were $23.2 billion
compared with $20.7 billion at December 31, 2005. Securities
59